11
OIV-2-SW-BA-e-2010
3.3.7 Data Display
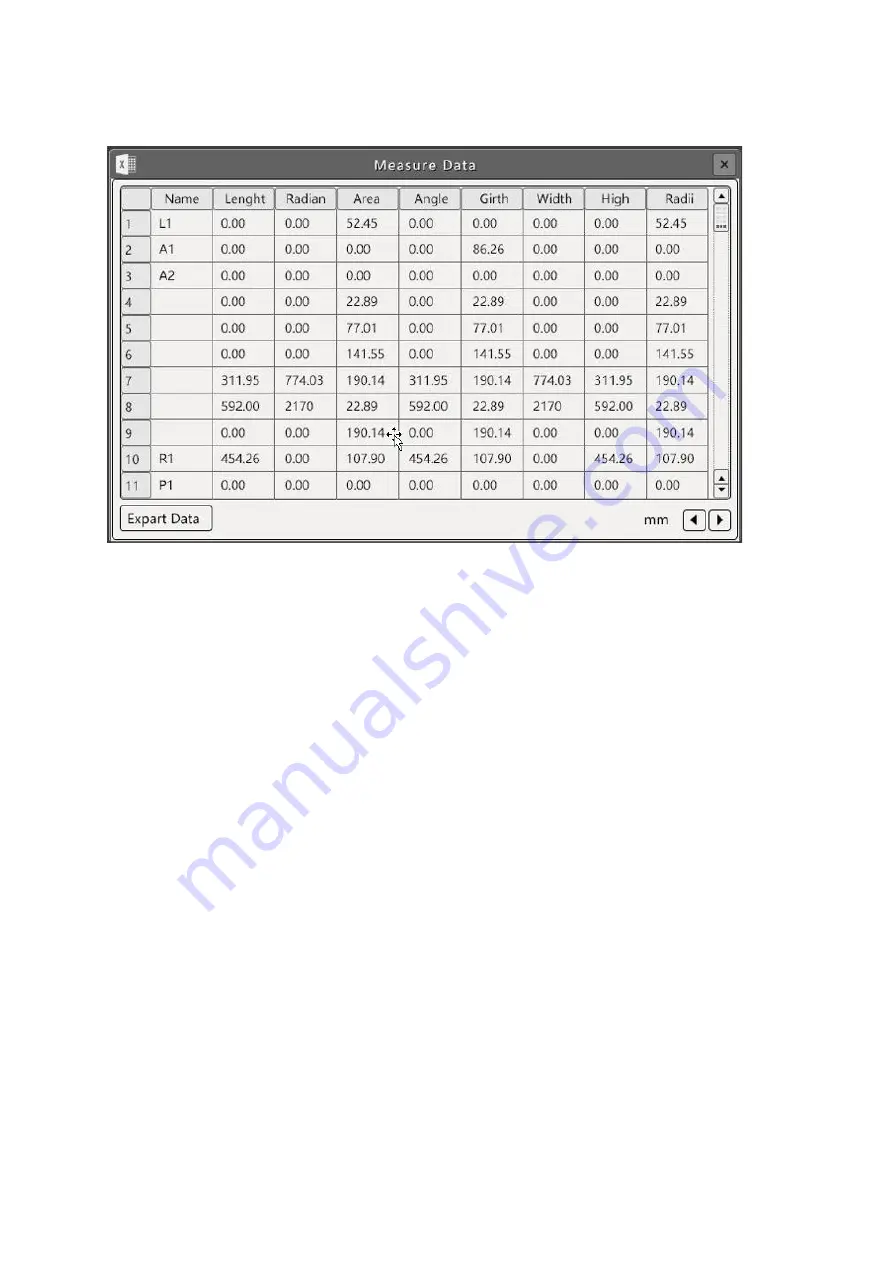
This table shows the details of the measuring elements drawn. By clicking on a line in the
chart, the corresponding measuring element is activated and coloured yellow.
By marking the measurement data in the chart, they can be changed.
Right-clicking on the element in the screen activates the corresponding measurement on the
screen.
By clicking on "Export Data" the chart can be saved to a USB stick and read later as an
Excel file.
The content of the Data Display can be adjusted as described in chapter 2.3.5.6.
(Note: Angles, broken lines and polygons cannot be changed).
3.3.8 Automatic edge finding
Click on the "Automatic edge finding" button to activate this function. You can automatically
detect the boundary of lines, circles, arcs, etc. based on the range of points and select the
nearest boundary as the measuring point. You can view and adjust the range of automatic
edge finding in the "Advanced Settings" user interface, adjusting the range in 5-25 pixels; this
function can significantly improve measurement accuracy.


