


H2 Stationary GrainGage User’s Guide
81
Harvest Mode
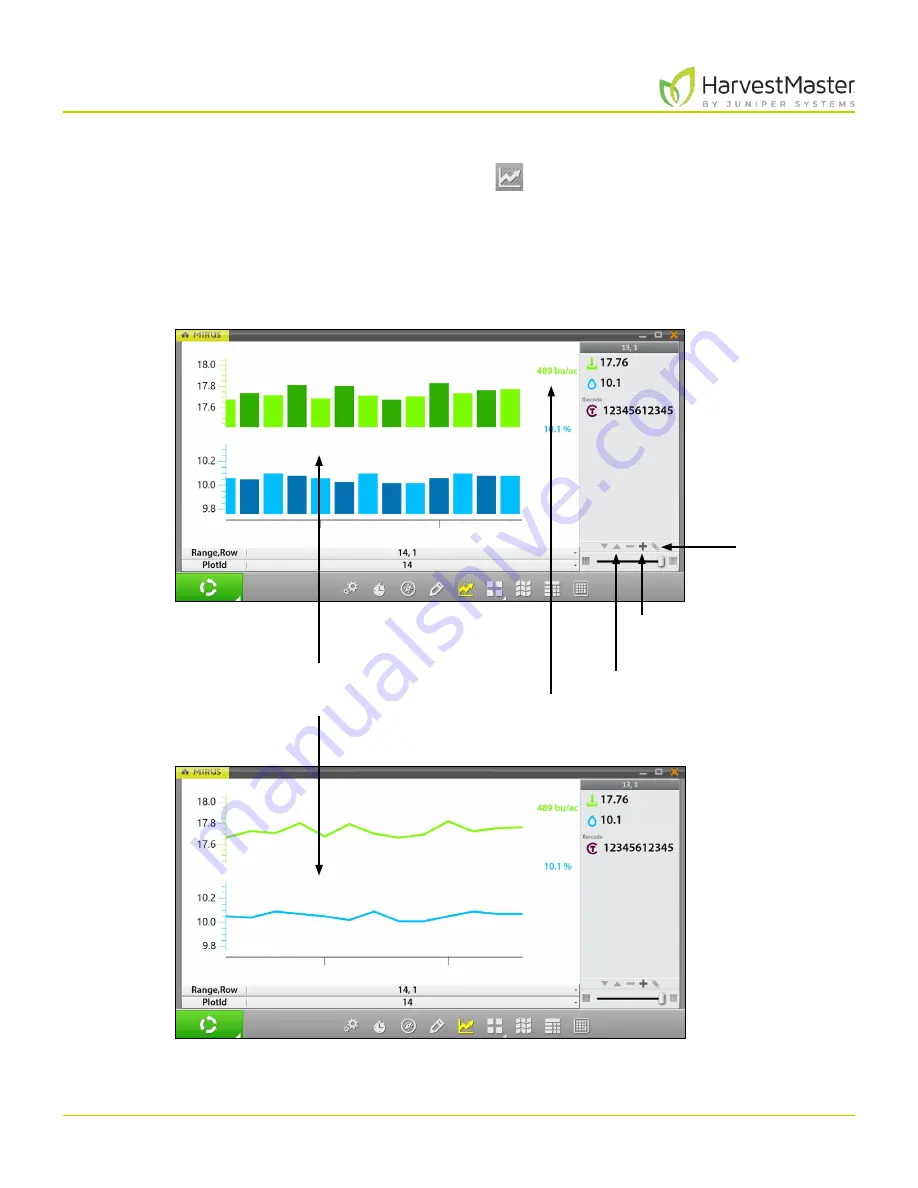
6.3.6 Graph View
To view the harvest data in graph form, tap the graph icon
in the toolbar.
The column to the right of the graph shows the data for the current plot.
In the graph, each bar (or point in the line graph) represents a plot. Each graph represents the map for two
different traits: weight (green) and moisture (blue). The values shown at the end of the graphs show the
averages. The green average shows the yield based on the weight measurements and plot size. To set the
yield parameters see
6.3.10 Configure Plot Size and Yield in Spatial Display on page 84
Move traits up
and down the
list.
Add or subtract
a trait from the
list.
Edit a trait.
Click on the graph to
switch between a bar
graph and a line graph.
Yield
Summary of Contents for HarvestMaster GRAINGAGE H2 STATIONARY
Page 1: ...USER S MANUAL...
Page 7: ...CHAPTER ONE Introduc tion...
Page 18: ...CHAPTER T WO Mirus and H2 Stationar y GrainGage Setup...
Page 36: ...CHAPTER THREE H2 Stationar y GrainGage Diagnos tic s and Aler t s...
Page 44: ...CHAPTER FOUR H2 Stationar y GrainGage Calibration...
Page 60: ...CHAPTER FIVE Field Maps...
Page 69: ...CHAPTER SIX Har ves t Mode...
Page 87: ...Standard Grain Information APPENDIX A...
Page 89: ...Troubleshooting Mirus APPENDIX B...
Page 94: ...Limited Warrant y APPENDIX C...


