Cub Instrument User Manual V2.4
Unrivalled Gas Detect
ion.
Page 22 of 46
ionscience.com
The right-hand area displays a line graph of the readings. The blue line indicates the recorded gas
level. The red and orange lines indicate the high and low alarm levels respectively.
If a record in the left-hand area is clicked on, a vertical green line is added to the graph to indicate
the time of the reading. Above the line, the gas level at that time and exact time of the reading are
displayed.
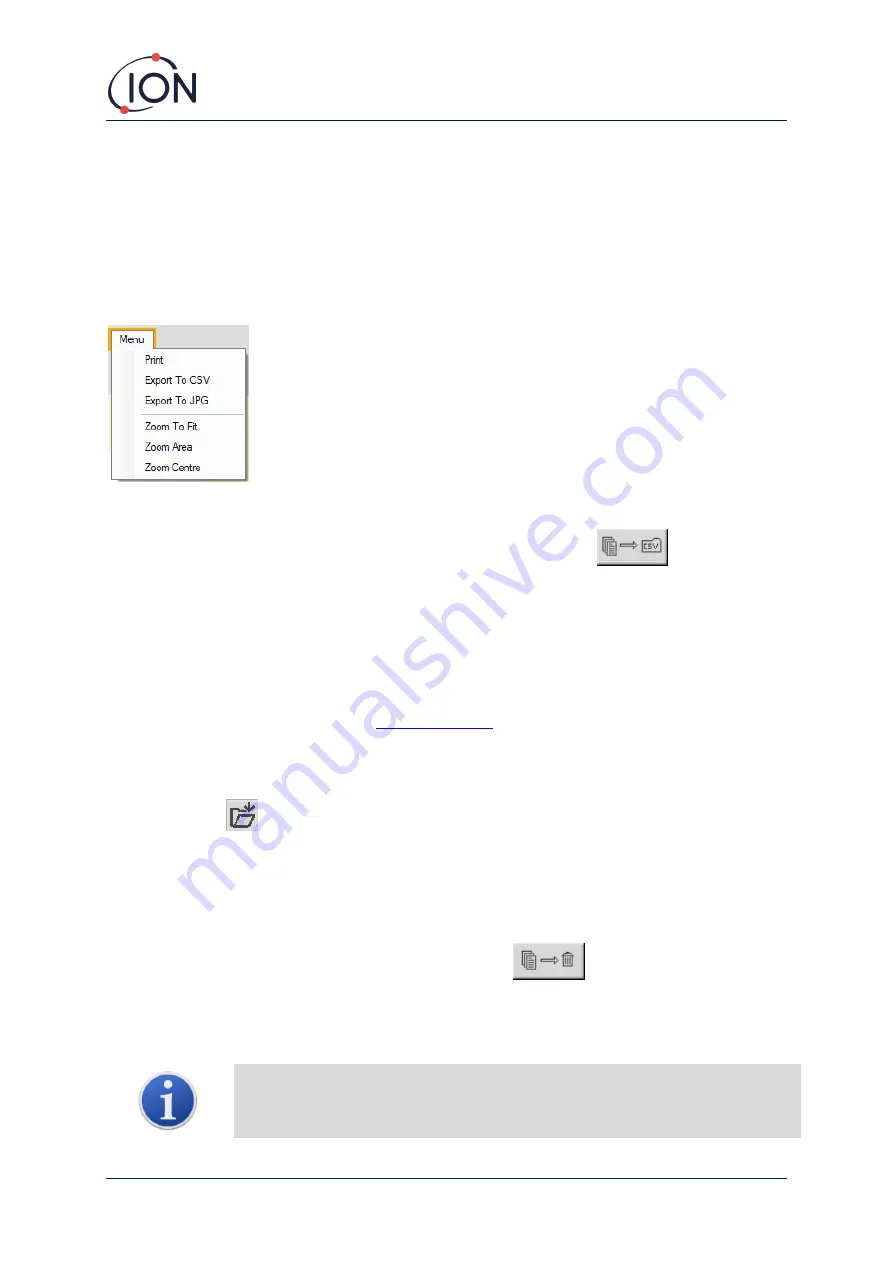
The
Menu
button displays the following options for printing, exporting and viewing the data:
Saving Logged Data to a CSV File
To save a data log to a CSV file, press this button in the
Datalog
column:
The option is also available on the above menu.
A standard Windows “Save As” type window is then displayed. Select a filename and location for the
file in the usual way and click
Save
.
Note that data may automatically be saved to a CSV file when a Cub is connected to a docking
station, if this option is specified on the
Archive Cub Records
To archive Cub data and remove it from the list of connected Cubs, tick its
Archive
checkbox and
click this button:
The Cub data is then archived to the Instruments folder on the C: drive of the PC. The Cub is
removed from the
Cubs
page list (unless connected to CubPC again).
Delete Logged Data
To delete all logged data stored by a Cub, press this button:
A message is then displayed requesting that the deletion be confirmed. Once confirmed, the
deletion will take place.
Important note:
The delete function deletes all logged data from a Cub. Ensure
any data you need to edit is exported in CSV format before selecting this option.


