


157
State
N/A
Shows the state of the server. It takes one of the
following values:
Disable
d: The selected server is disabled.
Not Ready
: The server is enabled, but IP
communication is not yet up and running.
Ready
: The server is enabled, IP communication is up
and running, and the RADIUS module is ready to
accept accounting attempts.
Dead (X seconds left)
: Accounting attempts were
made to this server, but it did not reply within the
configured timeout. The server has temporarily
been disabled, but will get re-enabled when the
dead-time expires. The number of seconds left
before this occurs is displayed in parentheses.
This state is only reachable when more than one
server is enabled.
Round-Trip Time
radiusAccClientExtRo
undTripTime
The time interval (measured in milliseconds) between
the most recent Response and the Request that matched
it from the RADIUS accounting server. The granularity
of this measurement is 100 ms. A value of 0 ms
indicates
that there hasn't been round-trip communication
with the server yet.
Buttons
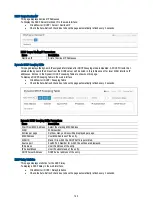
Auto-refresh: Check this box to refresh the page automatically. It will do so every 3 seconds.
Refresh: Click to refresh the page.
Clear: Clears the counters.
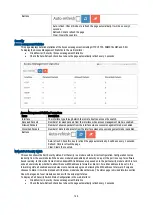
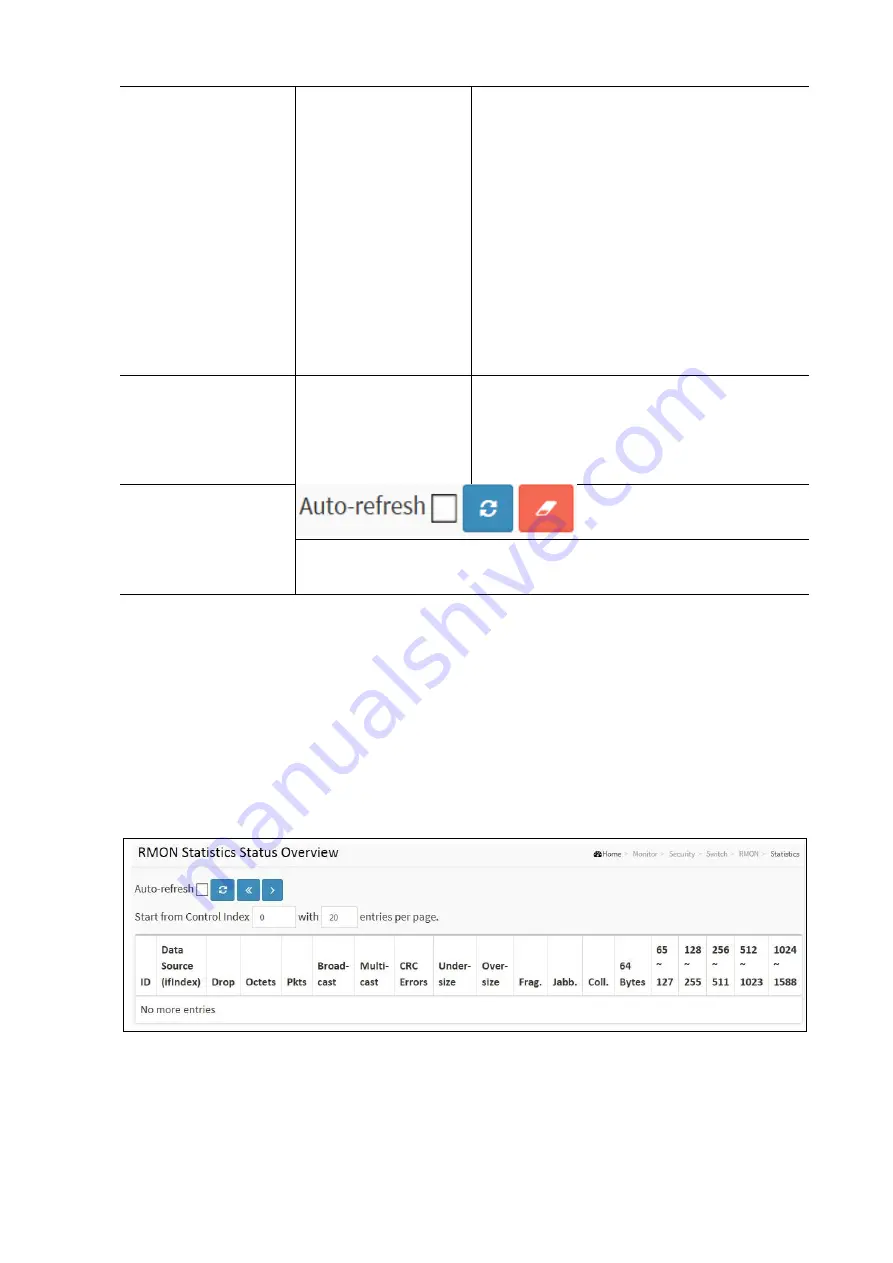
Switch RMON Statistics
This page provides an overview of RMON Statistics entries. Each page shows up to 99 entries from the Statistics table,
default being 20, selected trough the “entries per page” input field. When first visited, the web page will show the first 20
entries from the beginning of the Statistics table. The first displayed will be the one with the lowest ID found in the
Statistics table. The “Start from Control Index” allows the user to select the starting point in the Statistics table. Clicking
the button will update the displayed table starting from that or the next closest Statistics table match. The form will use
the last entry of the currently displayed entry as a basis for the next lookup. When the end is reached the text “No more
entries” is shown in the displayed table.
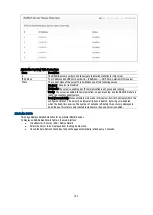
To display The RMON Statistics Table in the web interface:
Click Monitor / Security / Switch / RMON / Statistics
Enter a Start from Control Index and the number of entries to be displayed per page.
Check the Auto-Refresh check box to have the page automatically refresh every 3 seconds.


