SpectraTrend HT User’s Guide 3.2
80
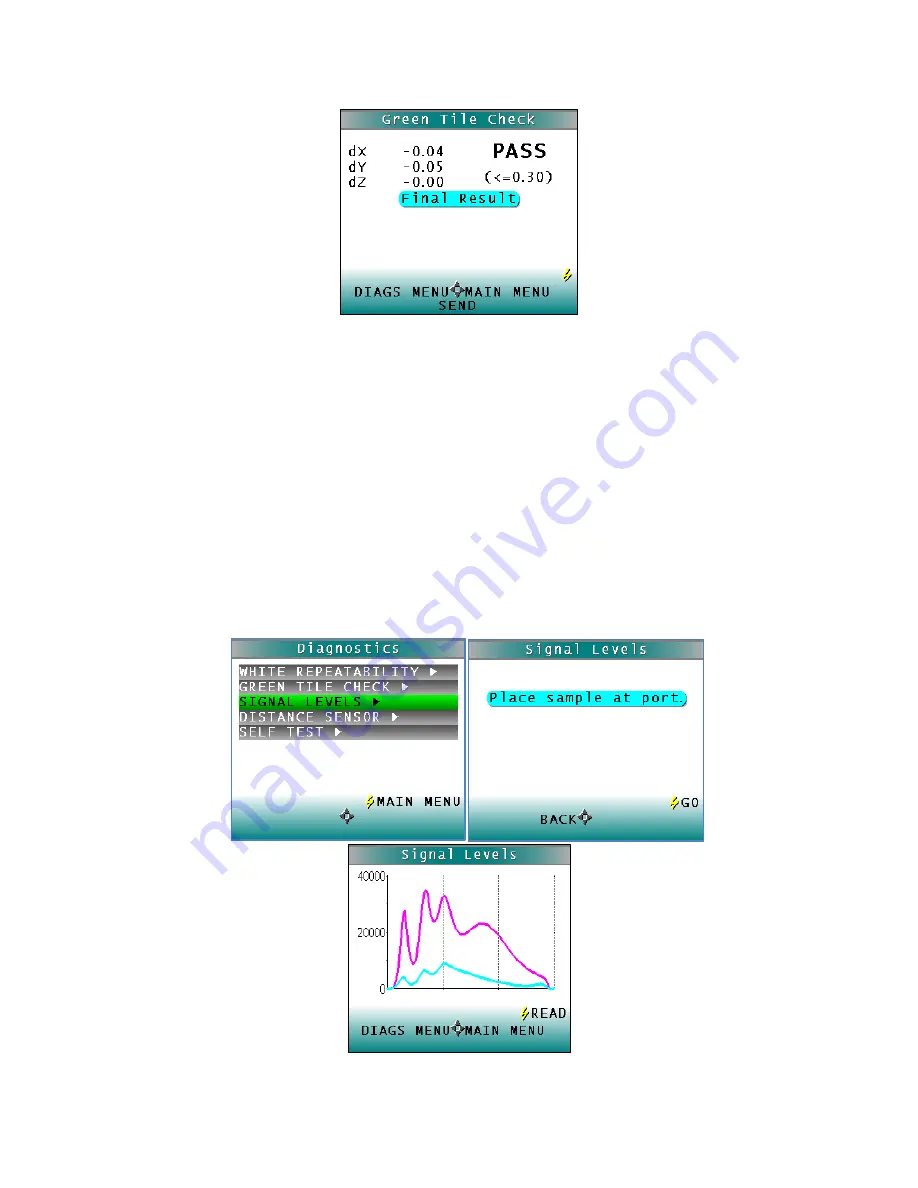
Figure 103. Results of Green Tile Check
Readings are taken in X, Y, Z and the dX, dY, dZ values are reported at the end and compared to
an individual tolerance of
≤
0.30. To return to the
DIAGNOSTICS MENU
select the
LEFT ARROW
.
To return to the
MAIN MENU
select the
RIGHT ARROW
and to
SEND
the results, select the
DOWN ARROW
.
Signal Levels
To examine the spectral signal levels for a sample, select the
SIGNAL LEVELS
by pressing the
RIGHT ARROW
. Place the sample of interest at the port and press
GO
when ready. Normally
this will be the white tile, but HunterLab’s Technical Support staff may in
struct differently. Place
the sample and press
GO
.
The sample and monitor channels are plotted on a graph for examination by HunterLab’s
Technical Support staff.
Figure 104. Signal Level Diagnostic
Summary of Contents for SpectraTrend HT
Page 6: ...SpectraTrend HT User s Guide 3 2 6...
Page 21: ...SpectraTrend HT User s Guide 3 2 21...
Page 22: ...SpectraTrend HT User s Guide 3 2 22...
Page 23: ...SpectraTrend HT User s Guide 3 2 23...
Page 24: ...SpectraTrend HT User s Guide 3 2 24...
Page 25: ...SpectraTrend HT User s Guide 3 2 25...
Page 26: ...SpectraTrend HT User s Guide 3 2 26...
Page 27: ...SpectraTrend HT User s Guide 3 2 27...
Page 28: ...SpectraTrend HT User s Guide 3 2 28...
Page 76: ...SpectraTrend HT User s Guide 3 2 76...
Page 86: ...SpectraTrend HT User s Guide 3 2 86...


