


SmarTracks Diagnostics v.3.16 Installation Guide & User Manual
35
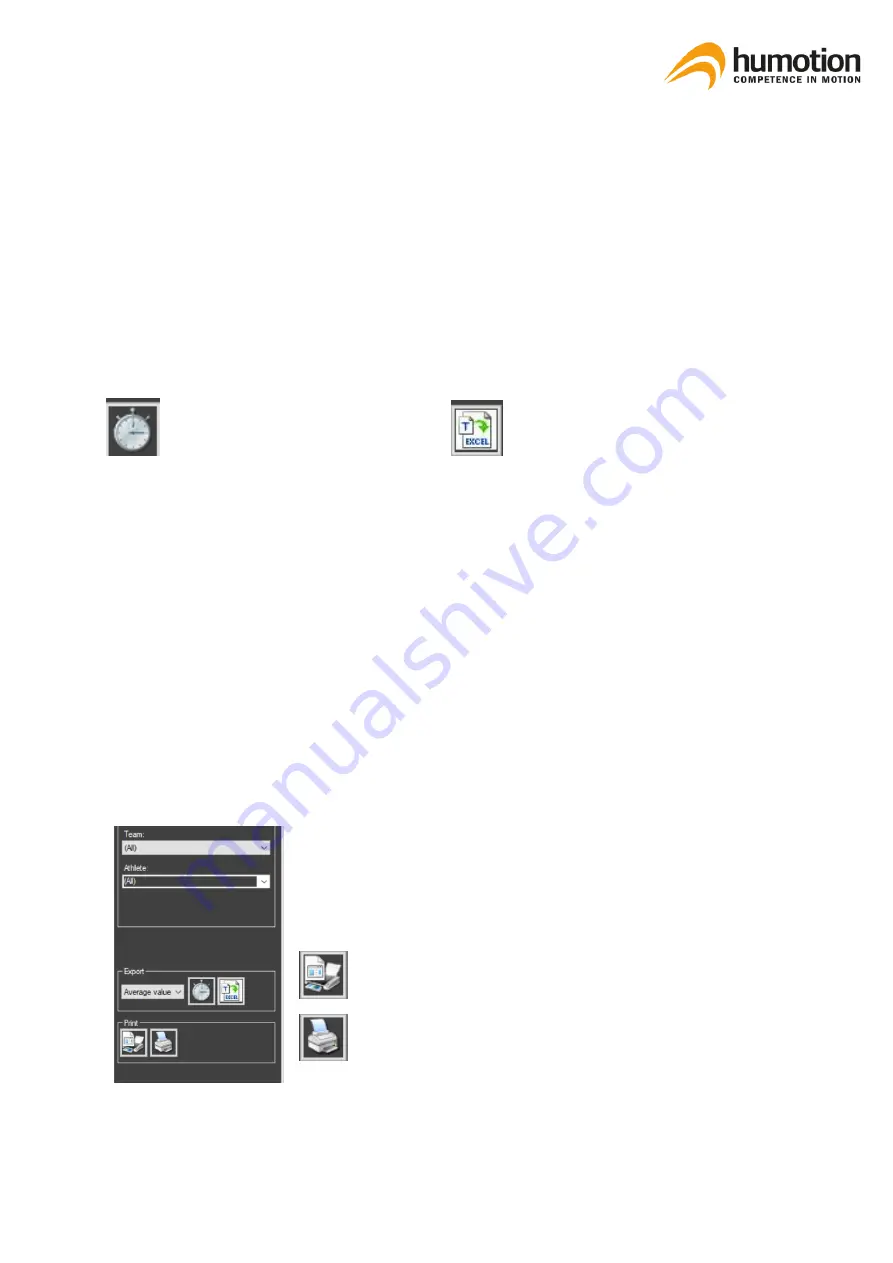
STEP 2: Filter the test results you wish to export using the Filter menu.
STEP 3: Select which data you wish to export in the Export menu.
The drop-down menu shows three options:
▪
All values: Export all values per athlete.
▪
Average values: Export only the average time per athlete.
▪
Best values: Export only the best time per athlete.
STEP 4: Click one of the export buttons. There are two export buttons:
Export key attributes of a measure-
ment.
Export all attributes of a measurement.
The test results are exported to an Excel file.
The exports are designed to compile the data reflected in the spider diagram. We recommend to only
use it with the assessments of the
diagram’s
predefined test battery. This includes:
▪
Linear sprinting of at least 5m
▪
Tapping test of at least 6 seconds
▪
At least one jumps type
STEP 5: Save the exported test results in the desired format, e.g. Excel, HTML, etc.
7.5.3.
Printing the spider diagram
STEP 1: Go to the “Compare” tab
STEP 2: Filter the test results you wish to export using the Filter menu.
STEP 3: Go to the Print menu in the left column.
You can preview the document by clicking on the “Print pre-
view” button.
You can directly print the document by clicking on the “Print
chart” button.