


Repair Information
172
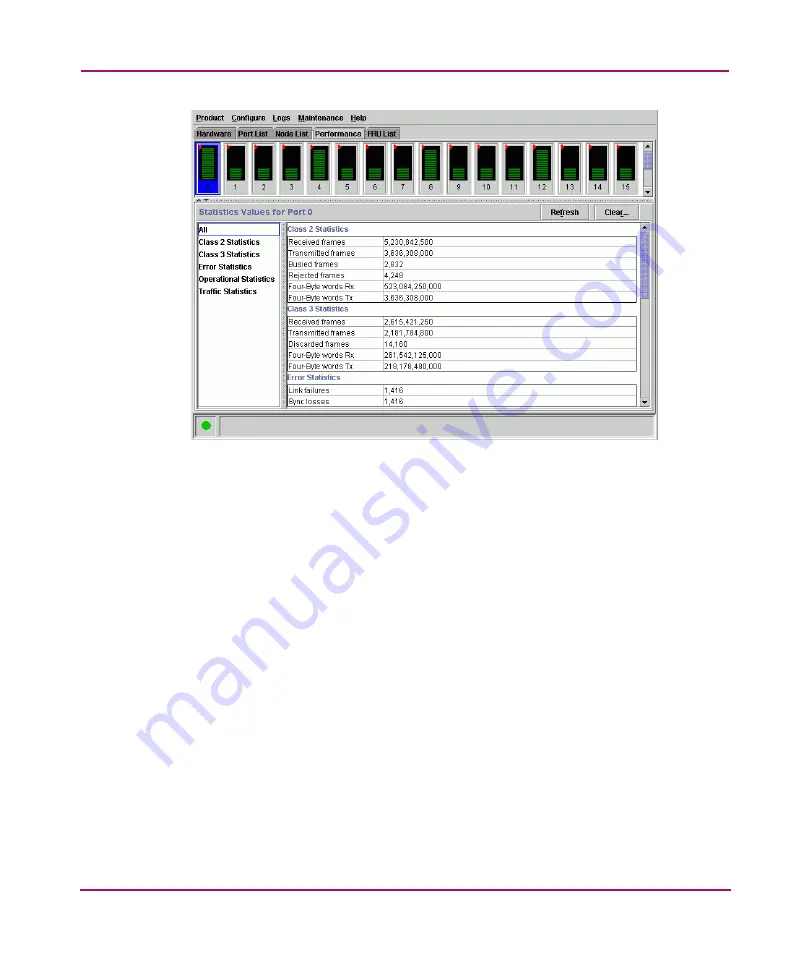
Figure 41: Performance View
Each port bar graph in the upper portion of the view displays the instantaneous
transmit or receive activity level for the port, and is updated every five seconds.
The relative value displayed is the greater of either the transmit or receive activity
(whichever value is greatest when sampled).
Each port graph has 20 green-bar level indicators corresponding to 5% of the
maximum throughput for the port (either transmit or receive). If any activity is
detected for a port, at least one green bar appears. A red indicator on each port bar
graph (high-water mark) remains at the highest level the graph has reached since
the port was set online. The indicator does not display if the port is offline, and is
reset to the bottom of the graph if the port detects a loss of light.
When the mouse cursor is passed over a port bar graph (flyover), the graph
highlights with a blue border and an information pop-up displays the port
operational state or WWN of the attached device. Click a port bar graph to display
statistics values for the port. Right-click a port bar graph to open a pop-up menu
to:
■
Open the Port Properties, Node Properties, or Port Technology dialog boxes.
■
Block or unblock the port.
■
Enable or disable port beaconing.
■
Perform port diagnostics.
Summary of Contents for StorageWorks 2/140 - Director Switch
Page 18: ...About this Guide 18 Director 2 140 Service Manual ...
Page 160: ...Diagnostics 160 Director 2 140 Service Manual ...
Page 262: ...FRU Removal and Replacement 262 Director 2 140 Service Manual ...
Page 270: ...Illustrated Parts Breakdown 270 Director 2 140 Service Manual ...
Page 318: ...Information and Error Messages 318 Error Messages ...
Page 388: ...Event Code Tables 388 Director 2 140 Service Manual ...