


116
Graphing in Solve
In the
SYMB
view, enter the equation
Y=X^3-2X
2
-5X+2
into
E1
.
In the
NUM
view, enter the known value of
Y=1
,
ensure that the highlight is on
X
, making it the
active
variable, and then press
PLOT
.
The
PLOT
view shows two curves. The horizontal line is the left side of the
equation which, when the known value of
Y=1
is substituted, forms a
constant straight line. The other curve is the right hand side of the equation
which, since
X
is the active variable, forms a cubic. In this case the scale
chosen is appropriate but this will not always be the case and some
adjustment might be required in the
PLOT
SETUP
view.
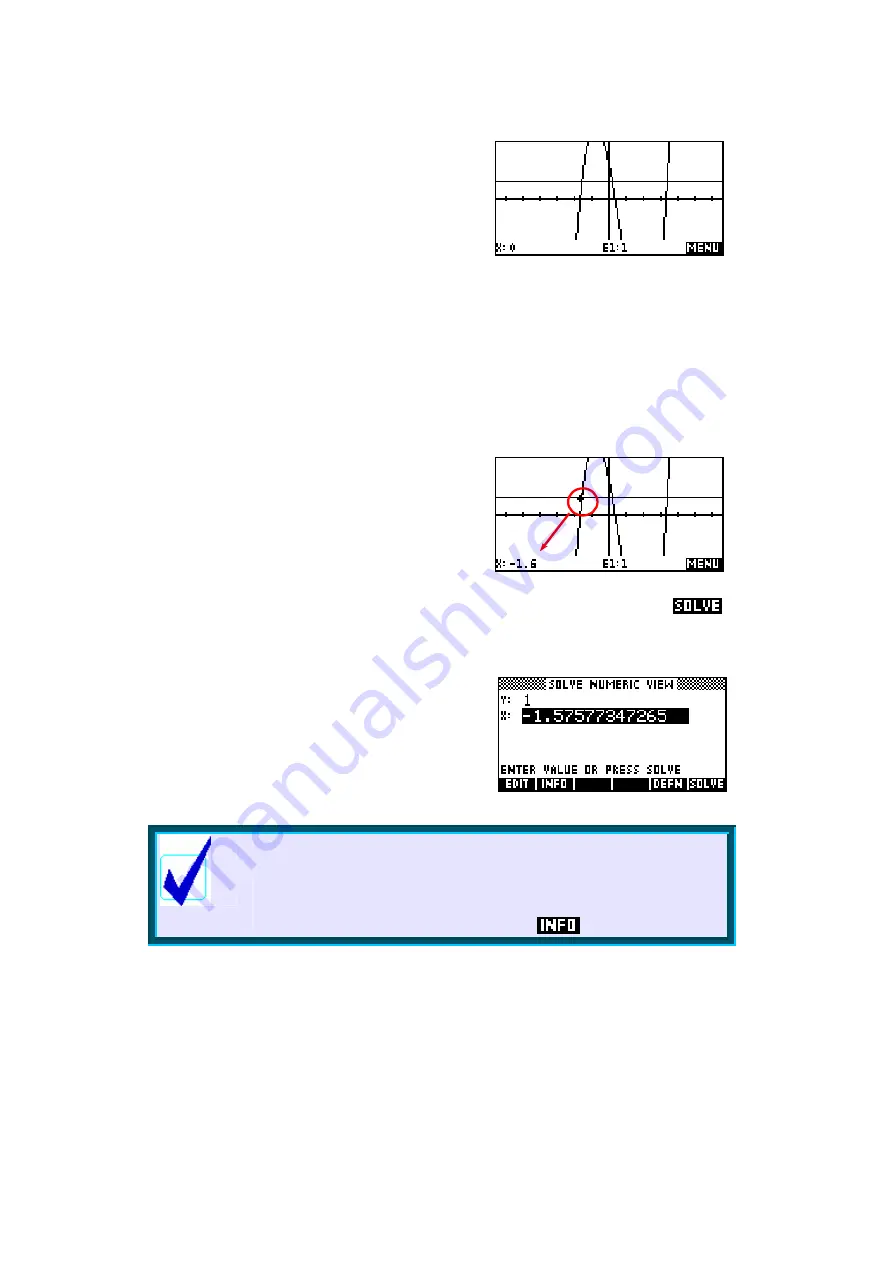
Transferring approximate solutions
We require values where the two curves
intersect. Using the arrow keys, move the
cursor near to the first intersection point. I
found (see right) that -1.6 seemed to be a
good approximation. Now change back to the
NUM
view and you will find that
this approximation has been carried back as the initial estimate. Press
to find the true value.
Repeat the process of obtaining an estimate in
the
PLOT
view and refining it in the
NUM
view to
find the other two solutions. See page 118 for
information on the effect of the active variable
on what you see in the
PLOT
view.
Calculator Tip
The Solve aplet is not able to cope with inequalities.
Although there is no error message when you use < or >,
the answer it supplies is not what you would expect. What
is worse is that they are reported in
as correct!


