background image

12

FMS 1 - Fluorescence Monitoring System

© 2017 Hansatech Instruments Ltd

also discussed in 

Section 2

.

2.2

Hardware

The FMS 1 is supplied with the following hardware components:

Control Unit:

Houses all of the electronics, optics and light sources. Power is provided from the

external 12V mains adapter unit.

Fibre-Optic Interface:

Connects the internal optics to the sample.

Leaf-Clips:

Dark-adaptation clips and fibre-optic adapters are used to hold leaf sample relative to

the fibre-optic. These permit rapid screening of multiple samples.

12V Mains Adapter:

Powers the FMS control unit.

These components must be correctly assembled before the system can be operated.

An optional PAR / Temp leaf-clip is also available for whole leaf measurement. This

features a co-sine corrected PAR sensor and thermocouple

2.2.1

Connections to the FMS Control Unit

2.2.1.1

Electrical Connections

The following electrical connections are made to the rear of the control unit.

·

12 V mains power adapter plugs into the 12 V DC socket (E, Figure 1-3).

·

Serial cable links the Serial I/O socket (A, Figure 1-3) to a COMM port on the PC.

·

Optional control over external devices can be achieved by connection to the “User Interface”

socket (B, Figure 1-3) (Chapter 2).

Summary of Contents for FMS1

Page 1: ......

Page 2: ... Ltd All rights reserved No parts of this work may be reproduced in any form or by any means graphic electronic or mechanical including photocopying recording taping or information storage and retrieval systems without the written permission of the publisher FMS 1 ...

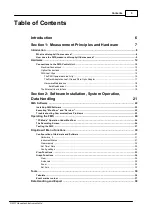
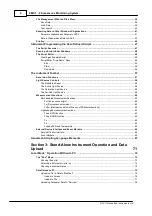
Page 3: ...nce 18 Bulb Replacement 18 The External User Interface 19 Section 2 Software Installation System Operation Data Handling 21 FMS Software 22 Installing FMS Software 22 Executing Modfluor and Parview 22 Troubleshooting Communications Problems 23 Operating the FMS 24 PC Mode Operation Under Modfluor 24 The Recording Screen 24 Testing the FMS 27 Drop Down Menu Functions 30 Configuration of Hardware an...

Page 4: ... The Saturating Light Source 59 The Far Red Light Source 59 Measurement Functions 59 Dark adapted Measurement Routines 59 Fo fluorescence origin 60 Fm fluorescence maximum 60 Fv Fm Maximum quantum efficiency of PSII photochemistry 60 Light adapted measurement routines 62 The phi PSII function 62 The phi PSIIR function 64 Fs 65 Fo 65 Logging PAR and Temperature 65 External Device Interface and Even...

Page 5: ...ch Instruments Ltd The File Menu 78 Upload params 79 Configuring the Parameters Display 80 Parameter Data Export From Parview 81 Other Parview Functions 81 Local Mode Error Codes 82 Local Mode Menu Structure 84 References 85 ...

Page 6: ...suitable for development of complex protocols which may be programmed into the instrument using the simple drag and drop editor to generate user defined scripts These scripts automate the execution of experiments allowing complex protocols involving many control events to be operated with the same ease as single control event measurement such as Fv Fm Once programmed the FMS 1 can be operated as a...

Page 7: ...Section 1 Measurement Principles and Hardware ...

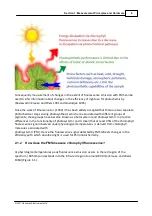
Page 8: ... energy from the photosynthetic apparatus in a manner which does not drive photosynthesis Energy is usually re emitted from the sample in the form of infra red radiation heat and red far red radiation which is known as chlorophyll fluorescence The competition between these processes for absorbed energy ensures that a reduction in the rate of one process will be associated with a corresponding incr...

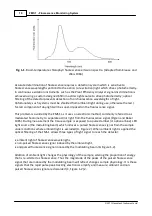
Page 9: ...s these groups have become known as photosystem I and photosystem II In practice differences in the functionality of photosystem I and II mean that at least 95 of the chlorophyll fluorescence signal observed under physiological temperatures is derived from chlorophyll molecules associated with photosystem II PSII Hence the fluorescence signal detected by FMS reflects changes in the efficiency with...

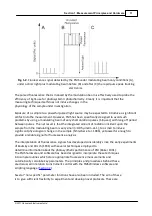
Page 10: ...y referred to as modulated fluorometry to separate actinic light from the fluorescence signal Ögren and Baker 1985 During measurement the tissue sample is exposed to a pulsed amber or optional blue LED light source the modulating beam which induces a pulsed fluorescence signal from the sample under conditions where ambient light is excluded A Figure 2 When ambient light is applied the optical filt...

Page 11: ...s The net result is that the integrated amount of radiation incident upon the sample from the modulating beam is very small 0 05 µmolm 2s 1 too small to induce significant physiological change in the sample Schreiber et al 1986 yet powerful enough to provide a reliable signal for fluorescence analysis The interpretation of fluorescence signals has developed considerably since the early experiments...

Page 12: ...ning of multiple samples 12V Mains Adapter Powers the FMS control unit These components must be correctly assembled before the system can be operated An optional PAR Temp leaf clip is also available for whole leaf measurement This features a co sine corrected PAR sensor and thermocouple 2 2 1 Connections to the FMS Control Unit 2 2 1 1 Electrical Connections The following electrical connections ar...

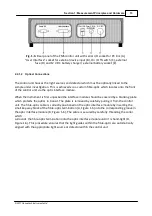
Page 13: ...le When the instrument is first unpacked the interface module should be covered by a blanking plate which protects the optics in transit The plate is removed by carefully pulling it from the control unit The fibre optic cable is correctly positioned on the optic interface module by inserting the small key way block of the fibre optic termination A Figure 1 6 into the corresponding groove in the op...

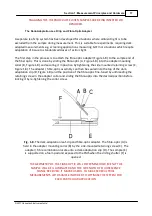
Page 14: ...RMANCE OF FMS Finally the sample end of the fibre optic should be positioned close enough to the tissue under investigation to detect a strong signal Typically it will have to be within 1 5 cm of the tissue usually orientated in a manner which minimises fibre nduced shading A pair of leaf clip systems are available for this purpose 2 2 1 3 FMS Leaf Clips The PAR temperature leaf clip The optional ...

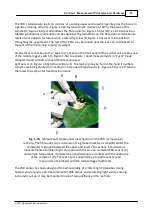
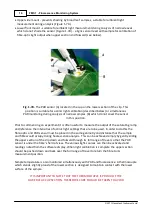
Page 15: ...n Local mode Chapter 3 and connect on board thermocouple and light sensor C Figure 1 5A to the control unit The leaf clip may be held in the hand if multiple samples are being studied or mounted on a standard tripod mount E Figure 1 5A via a thread in the lower clip section for fixed position work Fig 1 7A A broad leaf sample under investigation in the PAR temperature leaf clip The fibre optic A i...

Page 16: ...ference the intensities of actinic light settings that are to be used In order to do this the fibre optic and PAR sensor must be placed in the same geometry and distance that the sample and fibre would occupy during fluorescence analysis This can be achieved simply by gently sliding the upper section of the clip down and forward through its full range of travel so that the PAR sensor is under the ...

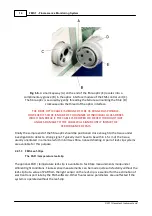
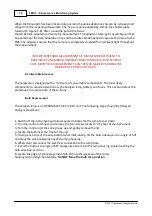
Page 17: ...osition by tightening the side mounted retaining screw C Figure 1 8 The adapter fibre optic assembly can then be sealed into the top of the dark adaptation clip D Figure 1 8 and the position of the fibre optic fine tuned by unthreading the retaining screw in the adapter collar and sliding the fibre optic into the desired position before locking it by re tightening the collar screw Fig 1 8 The dark...

Page 18: ...imum of consumable components The most likely components to require attention are the halogen lamp battery and fuses This section details the procedures to replace both of these items Bulb Replacement The halogen lamp is an OSRAM 64255 8 V 20 W unit The following steps should be followed during replacement 1 Switch off the instrument and allow several minutes for the lamp to cool down 2 Turn the c...

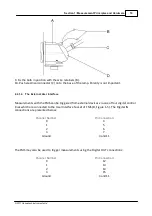
Page 19: ...er Interface Measurements with the FMS can be triggered from external devices via one of four digital control lines which are connected to the User Interface Socket of FMS B Figure 1 5 The Digital IN connections are presented below Channel Number Pin Connection 0 4 1 5 2 6 3 7 Ground 3 and 11 The FMS may also be used to trigger measurements using the Digital OUT connections Channel Number Pin Conn...

Page 20: ...20 FMS 1 Fluorescence Monitoring System 2017 Hansatech Instruments Ltd Analogue output channel connections are Pin Connection Analogue Output 10 Analogue Ground 2 ...

Page 21: ...Section 2 Software Installation System Operation Data Handling ...

Page 22: ...satech Instruments This contains a sub directory with icons for running both the Modfluor and Parview applications an Uninstall program and links to the help documentation PLEASE NOTE THAT THE FMS SOFTWARE IS A 32 BIT WINDOWS PROGRAM THEREFORE THIS SOFTWARE IS NOT COMPATIBLE WITH PC S RUNNING WIN 3 1 3 1 2 Executing Modfluor and Parview Both programs may be run without connection to the FMS Howeve...

Page 23: ...400 baud rate Some older serial port chip sets may not be able to cope with this speed of data transfer resulting in communications problems or file uploading problems The following procedure should be followed to troubleshoot such communications issues 1 Check the serial cable connection to both the PC and the FMS control unit 2 Check that the x is entered into the command line if anything other ...

Page 24: ...trol unit display panel When the instrument is first used it will only contain two default scripts for measurement of Fv Fm and PSII It is therefore sensible to use PC mode to test the system and generate further scripts which are more suited to individual applications Local mode operation is discussed in Section 3 3 2 1 PC Mode Operation Under Modfluor Once the Modfluor program has successfully c...

Page 25: ... plot ensures that data collection is continuous up to a maximum length of approximately 50 minutes The PAUSE button in the instrument toolbar may be used to suspend data collection operating as the computer equivalent of lifting the pens off a chart recording If this function is used to limit data logging to specific periods of interest much longer experimental protocols may be run Data is digita...

Page 26: ...0 to 50 in the edit box located next to the Actinic button The Actinic Light Source CHANGES IN THE ACTINIC OUTPUT LEVEL ONLY TAKE EFFECT WHEN THE ACTINIC SOURCE IS INITIALISED THE ACTINIC LIGHT MUST BE TOGGLED OFF AND THEN ON TO EFFECT AN INTENSITY CHANGE THE ACTINIC LIGHT SOURCE The saturation pulse is activated each time the Pulse button is pressed The button remains indented during pulse applic...

Page 27: ... using the dark adaptation clip or by covering the sample in the PAR temperature clip 2 Start a new recording by pressing the Record button on the instrument toolbar The dark adapted fluorescence yield should plot across the data recording area This is the minimum fluorescence signal from the sample and should be within the range of 10 700 bits for reliable measurement If the signal is too small t...

Page 28: ...ensity by increasing the distance between the sample and fibre optic It is also important to check that the instrument is correctly configured to record the maximum level of fluorescence when the saturation lamp is used This may achieved with the following short experiment 1 Dark adapt a second piece of spare tissue for a minute of two 2 Press the Record button to start a fresh recording 3 Set the...

Page 29: ...s respectively The gradual increase in the magnitude of the pulsed fluorescence signal up to the 80 unit pulse indicates that a pulse intensity smaller than 80 units is not powerful enough to saturate PSII Consequently the pulse intensity should be set to 80 units to ensure accurate measurement of Fm and PSII A second important function of the light pulses is to check that the maximum fluorescence...

Page 30: ...and PSII will be stored when measurements are made As referenced above all of the FMS configuration and data management facilities are accessed from the drop down menu C Figure 2 1 whilst execution of measurements and on line control of instrument light sources is initiated via the instrument toolbar D Figure 2 1 The following sections detail the configuration and data management facilities availa...

Page 31: ...re Status Clear memory Set Time Date Config settings 3 3 1 2 Instrument Status Before operating FMS in a remote situation it is useful to know what user defined script files are loaded into the memory of the instrument how much memory capacity is available for data storage and whether the battery holds sufficient charge to complete the experiment The status command interrogates the instrument to g...

Page 32: ...he memory space If file number 5 is entered into the above prompt box Figure 2 7 files 5 through 10 inclusive will be deleted Figure 2 7 Fig 2 7 File deletion prompt indicating that files 5 through 10 inclusive will be deleted 3 3 1 4 Set Time Date The FMS has an on board timing chip which can be used to log when experiments are executed in Local mode The Set Time Date hardware function allows the...

Page 33: ...tings are written to the MODFLUOR INI file when the program is exited and re applied when the program is next operated Once the instrument has been configured it is useful to set the software for a clear display of the data as it is acquired These options are located under the View menu 3 3 2 View Functions When the program is first run the default screen displays both the instrument monitoring ba...

Page 34: ... for pasting into another Windows package Each of the parameters measured by FMS is defined in Measurement Functions 3 3 3 Graph Functions Initial data recording screen settings are designed to display to the full fluorescence detection range of the instrument on time base of 0 to 2 min Data from experiments that exceed this time base is automatically scrolled during recording so that some of the ...

Page 35: ... the zoom function the mouse cursor should be moved to the area of interest in the data recording area The left mouse button should be held down whilst the area to be zoomed is defined by dragging the cursor across the data recording area A box is generated to outline the area of the zoom before it is enlarged to fill the data recording area 3 3 3 4 Set Axis Manual control over axis setting and ot...

Page 36: ...TED IT MAY BE DIFFICULT TO VISUALISE THE PULSE WITHOUT ZOOMING THE TRACE The individual data points which make up the recording may be accessed from the Tools menu 3 4 Tools The Tools menu contains items which relate to the raw data output from the A D converter Tools Tabulate Event marker colour 3 4 1 Tabulate Raw data can be presented during or after recording in tabulated form by selecting the ...

Page 37: ...ight sources to the sample is event marked on the data recording screen with a different coloured arrow for actinic pulse and far red light sources The default colours and data tags in the tabulated output for these are yellow white and red respectively with blue reserved for user applied event markers The colour of each type of marker can be specified by selecting the appropriate marker type from...

Page 38: ...e common to any computer package Files Save data Load data Upload to screen Upload to file Text search Params to clipboard Params to ASCII Data to clipboard Data to ASCII Print graph Print params Set printer page Exit In the case of FMS Modfluor is used to transfer trace data which has been stored to the control unit s on board memory Upload to screen Upload to file These functions are discussed i...

Page 39: ... box Up to 250 characters of text may be attached to the file as a reference which can be searched on during data retrieval Text Search When finished both trace and associated parameter data if measured are saved to file which is stored with a DAT extension 3 5 1 2 Load Data Data files can be retrieved into the FMS software package using the Load data function If a trace is already present on scre...

Page 40: ...saved and requests confirmation of the action Figure 2 18 Once confirmed the file will load with data recording area and Parameters Window updated accordingly Fig 2 18 Confirmation box for file loading 3 5 1 3 Text search As described in section 2 4 5 1 1 a descriptive text reference can be attached to each data file as it is saved The Text search function is provided for searching these reference...

Page 41: ...ns The data recording screen contains two types of information at the end of a PC mode experiment trace data is graphically displayed as a chart recorder emulation and parameter data is stored in the Parameters window Both types of information can be cut to the Windows clipboard for pasting into other applications via the Params to clipboard and Data to clipboard functions or exported as ASCII fil...

Page 42: ...e spreadsheet Figure 2 20 Fig 2 20 FMS parameters data pasted directly into Excel The parameters are listed as they were measured in descending order with the final parameter at the bottom of the list This basic format means that data from several replicate experiments can be pasted next to earlier data in the same spreadsheet With replicate data pasted in a row across the spreadsheet calculation ...

Page 43: ... data packages 3 5 2 2 Data to Clipboard and Data to ASCII The raw fluorescence data which forms the recorder emulation trace is also available for export via the Data to clipboard command This operates in a similar manner to parameter export Params to Clipboard with numeric values transferred as a text string The procedure for pasting to the clipboard contents remains unchanged However the increa...

Page 44: ...oard pass made using the reported data number as the first point in the second pass A maximum of four passes may be required to paste a maximum length trace The data is pasted in the destination application as a single of column of sequential readings Figure 2 22 Fig 2 22 Tabulated trace pasted directly into into Excel Data points are stored every 0 11 sec As a result a column of time information ...

Page 45: ...orted data Once in this format it is simple to plot the data as an X Y plot for presentation Figure 2 24 Fig 2 24 Data plot of signal against time using Excel Chart Wizard The Data to ASCII function writes all of the trace data to a user named ASCII file in two column comma delimited format Time of reading sec Signal value bits ...

Page 46: ...inted to most Windows printer drivers using the Print graph and Print params commands respectively When selected the print dialogue box shows the current default printer driver and permits the selection of colour or monochrome printing depending upon the type of printer selected Figure 2 25 Fig 2 25 Print dialogue box The selected printer settings can be changed through the Print setup dialogue bo...

Page 47: ...s The FMS has been developed in parallel with Hansatech Scripting Language HSL The latter consists of a simple yet extremely versatile method for pre programming a maximum of six user defined control event measurement sequences referred to as protocols or scripts into the instrument Once programmed the protocols are available for operation by a single key press under Local mode outside of the labo...

Page 48: ...NUALLY EDITED INTO RECORDED SCRIPTS USING THE SCRIPT EDITOR THE SCRIPT EDITOR 3 6 2 Running a Script Under Windows The Run command executes the current script that is loaded in the script editor with data presented in the data recording area and parameters window if open View Functions as it is acquired Most of the individual script elements Hansatech Scripting Language Elements are designed to op...

Page 49: ...ntification information each time the script is executed in Local mode Creating an Example Script It is recommended that the TEXT element is used to insert information before use of certain Pause Elements to indicate that user intervention is required for the script to proceed e g WKEY WMON WDON WOFF The following example displays a text prompt Press SPACE BAR above the instrument monitoring bar w...

Page 50: ... elements which are to be executed in descending order during the experiment B Figure 2 28 Editing down loading and script file handling functions are contained within the drop down menu whilst further commands may be added using a drag and drop procedure to select items from the two pages of iconised script elements C Figure 2 28 The best way to appreciate the principles behind the script editor ...

Page 51: ...ame of script element Element parameters GAIN 50 MOD 3 The name of the script element is listed followed by a colon and numerical parameter s which define the element s function In the above case gain is applied at instrument setting 50 and the modulating beam is switched on at setting 3 Further elements may then be added to the script in the desired order of execution Available elements are prese...

Page 52: ...ragging the ID icon beneath the MOD element in the script and releasing the left mouse button A prompt box is generated requesting a pair of values M N These can be considered as number of treatments M and number of replicates N Thus 5 5 would denote a 25 plot experiment with 5 treatments replicated 5 times When entered the following line is added to the script ID 5 5 When this script is run in Lo...

Page 53: ...lowing command line is added to the script FVFM 2 5 100 0 7 The need for defined parameters adds complication to script development but their presence makes it possible to customise scripts to suit individual requirements and thus optimise the performance of the instrument A complete listing of the parameters associated with each script element is given in Hansatech Scripting Language The next sta...

Page 54: ...e wait for a fixed period of time command will be used by dragging the clock icon from page 1 to the script Figure 2 32 the program will prompt for the wait duration in units of seconds Fig 2 32 Wait for fixed period Icon A value of 100 sec should be entered to generate the following command line WAIT 100 0 After 100 sec the next command will be executed This will be a measurement of the quantum e...

Page 55: ...th larger scripts some of the editing and file handling functions are extremely useful These are accessed from the drop down menu 3 6 3 2 Script Editor Drop Down Menu The drop down menu in the Script Editor operates in a similar manner to the main drop down menu in the recording screen the individual commands are divided into groups and accessed under headings which broadly describe their function...

Page 56: ...on 3 The Download menu is used to transfer the script that is currently displayed in the Script Editor into one of the six protocol locations within the control unit The appropriate location is selected from the Download menu with the mouse or accelerator key a prompt indicates successful script transfer to the control box Download Protocol 1 Protocol 2 Protocol 3 Protocol 4 Protocol 5 Protocol 6 ...

Page 57: ...eriment A good analogy is the recording of key strokes by spreadsheet software to create re usable macro programs Throughout each experiment data is plotted to the data recording screen and presented on the instrument monitoring bar if active every 0 11 sec for a maximum of approximately 50 minutes Experiments may be run over longer periods if the Pause button is used to conserve memory space by s...

Page 58: ...ant during an experiment is it possible to monitor changes that relate to sample photochemistry As a result the optimum modulation intensity should be configured prior to starting the experiment on a piece of test tissue Testing the FMS as the FMS software will not allow changes whilst recording is in progress 3 7 2 2 The Actinic Light Source Actinic light is provided by operating the halogen satu...

Page 59: ... nm It is activated via the Far red button Figure 2 34 in a similar manner to the actinic source When active the LED operates at maximum output the small output in relation to ambient or other actinic light sources means that care should be taken when using the far red lamp to ensure that its effectiveness is not diminished by the presence of other light 3 7 3 Measurement Functions The FMS incorpo...

Page 60: ...Fm is attained when the dark adapted sample is exposed to an intense saturating pulse of light This temporarily reduces all PSII electron acceptors preventing PSII photochemistry The temporary absence of competition from photochemistry for absorbed energy ensures maximum fluorescence emission from the sample The Fm button initiates a saturating pulse of light using the intensity and duration setti...

Page 61: ...ler 1977 1978 Close correlation with other measures of quantum efficiency of photochemistry in a wide range of species Björkman and Demmig 1987 has resulted in widespread use of Fv Fm as a screening parameter for stress response The Fv Fm button initiates a routine to measure Fo Fm and calculate Fv Fv Fm The routine operates in three stages 1 The modulation beam only signal is averaged for 1 6 sec...

Page 62: ...surements of fluorescence yield from the sample in different defined states are required to estimate fPSII Initially the fluorescence yield of the sample under the ambient light regime is required Figure 2 37 Such measurements are often made after a sample has adapted to a particular light regime or environment and is operating at steady state Consequently the measurement is often referred to as t...

Page 63: ...p Incident photosynthetically active radiation C Fs Steady state fluorescence yield Bits Fm light adapted fluorescence maximum Bits fPSII quantum efficiency of PSII No Units Fm Fs Fm Genty et al 1989 qp photochemical quenching co efficient No Units Fm Fs Fm Fo qNP Non photochemical quenching co efficient No Units Fm Fm Fm Fo NPQ Alternative definition of non photochemical quenching No Units Fm Fm ...

Page 64: ...h the electron transport chain effectively opening PSII reaction centres and allowing measurement of a light adapted Fo usually given the notation Fo The fPSIIR function initiates the following sequence of events to make these measurements 1 Values of PAR and temperature are logged from the leaf clip these will be zero if the clip is not connected 2 The steady state fluorescence value Fs is determ...

Page 65: ...measurement function When activated the following 1 6 sec of data are averaged with the result written as Fs in the Parameters Window Fo Measurements of Fo can be made independently of the PSIIR function by operating the Fo button When active the actinic light is switched off far red light initiated for 5 sec and the fluorescence decline tracked The minimum value is written to the Parameters Windo...

Page 66: ...s that have been paused using the WDON WOFF elements Hansatech Scripting Language Elements A digital to analogue D A line is also provided for control of devices such as external LED light sources which require variable voltage 0 to 4095 mV control The D A line is toggled on off from the DAC button with required voltage output in mV set in the adjacent edit box Control is also possible during scri...

Page 67: ...e This page contains a complete listing of The script editor icon Its control functions User defined settings for respective control functions And logged measurements that are saved to on board memory in Local mode or written to the Parameters Window under PC operation For clarity the list is separated into four groups of elements Instrument Control Elements set instrument functions and light sour...

Page 68: ...nts halt script execution until a condition is fulfilled The LOG function sets the system to log data during each pause for full trace analysis Trace Logging Elements used in conjunction with the PAR temperature leaf clip to log sample environment and basic parameters relating to the trace ...

Page 69: ...oftware Installation System Operation Data Handling 2017 Hansatech Instruments Ltd Fluorescence Parameter Logging Elements automatically measure calculate store commonly referenced chlorophyll fluorescence parameters ...

Page 70: ...70 FMS 1 Fluorescence Monitoring System 2017 Hansatech Instruments Ltd ...

Page 71: ...Section 3 Stand Alone Instrument Operation and Data Upload ...

Page 72: ...display Thus as the user works through the menu structure the function of each key is up dated In practice the menu structure has been kept as simple as possible with affirmative actions generally initiated from the upper key and negative responses initiated from the lower key The FMS defaults to Local mode when it is switched on A brief introductory screen presents the instrument version identifi...

Page 73: ...28 Fm 100 Fv Fm 0 72 The script consists of three lines GAIN 50 MOD 3 FVFM 2 5 100 0 7 These set the gain modulating beam and initiate the fluorescence measurement The FVFM element is set to operate the element over a 2 5 second period averaging the Fo signal for 2 5 0 7 1 8 sec before applying 100 unit saturating pulse over a 0 7 sec duration to determine Fm Thus the Fo Fm and calculated Fv Fm va...

Page 74: ...Yes Run aborted Save Data No 4 1 1 2 Selecting a different script to run There are six memory locations in the FMS control unit which can accommodate a single experiment each Thus under Local mode operation it is important to be able to change location and execute any of the stored scripts The Exp function under the Run menu initiates the Select menu which can be used to select a particular experi...

Page 75: ...default instrument setting stores full data information However if fluorescence trace information is not a priority it is possible to save memory space by selecting Params only mode with the upper key labelled In this mode only the measurement parameters associated with logging elements Hansatech Scripting Language Elements are recorded They should be uploaded into Parview Uploading Parameter Data...

Page 76: ...for interrogation by the computer in PC mode This is done via the PC button in the Run menu Further information to troubleshoot communications problems may be found in Software Operation Section of this manual Section 2 4 1 2 1 Uploading Trace Data to Modfluor There are two different methods for transferring data from the control unit Individual data files may be selected by file storage number fo...

Page 77: ...een used trace data is presented in the data recording area The Parameters Window is up dated with the file number date and time of script execution and associated parameters The data is then available to further analysis storage or export via a drop down menu in Modfluor software The script that was used to generate the data can be viewed or refined with the Script Editor EDITED SCRIPTS CANNOT BE...

Page 78: ... name02 dat etc Each of these files can be loaded into the software and reviewed individually 4 1 2 2 Uploading Parameter Data To Parview Parview is a stand alone utility designed to allow easy upload and transfer of multiple parameter files to a spreadsheet program After initialisation the default parameter screen is loaded Figure 3 4 Fig 3 4 The Parview default parameter screen with main menu A ...

Page 79: ...ing the first file and last file settings Figure 3 5 Fig 3 5 Select files for upload prompt When OK is pressed the selected files are uploaded to the Parview program At this stage only three columns of file identification parameters are displayed in columns within the parameter display area experimental replicates are loaded by row Figure 3 6 Fig 3 6 Parameter presentation after upload The file id...

Page 80: ... 1 2 and 3 to display File Date and Time respectively The Autoset button assigns columns 4 through 255 to the next 255 parameters in the sequence If the sequence contains more than 255 parameters blocks of 255 parameters may be displayed at a time e g parameters 1 255 then 256 510 by following the prompts that are generated Individual types of parameter can be included or excluded from the data se...

Page 81: ...MPORTANT TO NOTE THAT PARAMETERS WHICH HAVE BEEN EXCLUDED FROM THE DISPLAY AREA ARE NOT INCLUDED IN THE ASCII FILE OUTPUT THE ASCII FILE OUTPUT WILL ONLY CONTAIN DISPLAYED PARAMETER TYPES If more than 255 parameters have been measured during a script it will be necessary to export the data in at least two ASCII files The first 255 parameters should be configured and exported to file1 asc then the ...

Page 82: ... Ltd 4 2 Local Mode Error Codes The FMS contains several functions which check both the status of the instrument and the validity of the data that is collected A brief list of possible error codes and their appropriate remedies is given below System Errors Data Errors ...

Page 83: ...83 Section 3 Stand Alone Instrument Operation and Data Upload 2017 Hansatech Instruments Ltd ...

Page 84: ...84 FMS 1 Fluorescence Monitoring System 2017 Hansatech Instruments Ltd 4 3 Local Mode Menu Structure ...

Page 85: ...LHCII chlorophyll protein complexes FEBS Lett 292 1 4 Horton P and A Ruban 1994 The role of light harvesting complex II in energy quenching In Photoinhibition of photosynthesis from molecular mechanisms to the field ed N R Baker and J R Bowyer pp 111 128 Oxford BIOS Scientific Publishers Ltd Kautsky H and A Hirsch 1931 Chlorophyllfluoreszenz und Kohlensäureassimilation Naturwissenschaften 19 964 K...

Page 86: ...ecessary equipment may be returned for repair replacement during the warranty period No charge will be made for parts labour under warranty but we reserve he right to charge for customs clearance and return carriage if appropriate For repairs outside of the warranty period please contact us at the address below for an estimate of cost and instructions regarding the return of equipment If the produ...

Reviews: