l
44
Ethernet Sensor Data Logging
The system automatically generates a set of operation logs that can be analysed by a
service engineer to diagnose any system faults. It generates these at all times.
Logs can be e-mailed to Guidance Marine Limited (
customerservices@guidance.
eu.com
) or to your DP Supplier in the event of a problem.
Taking Screenshots
The Screenshot option records every detail of
the current screen and stores it as a bitmap
image. Screenshots can be analysed by a
service engineer or e-mailed to Guidance Marine
Limited in the same way as log files.
Screenshots are stored with the data logs and
are included when data logs are exported.
To Take a Screenshot:
There are two alternative ways:
•
1. Click on the
Hotkeys
tab.
2. Click on
Grab Screenshot
.
•
Press the
F10
key.
The Grab Screenshot Button
Exporting Data Logs
The most recent data logs can
be exported to a removable
drive on the Dashboard
computer.
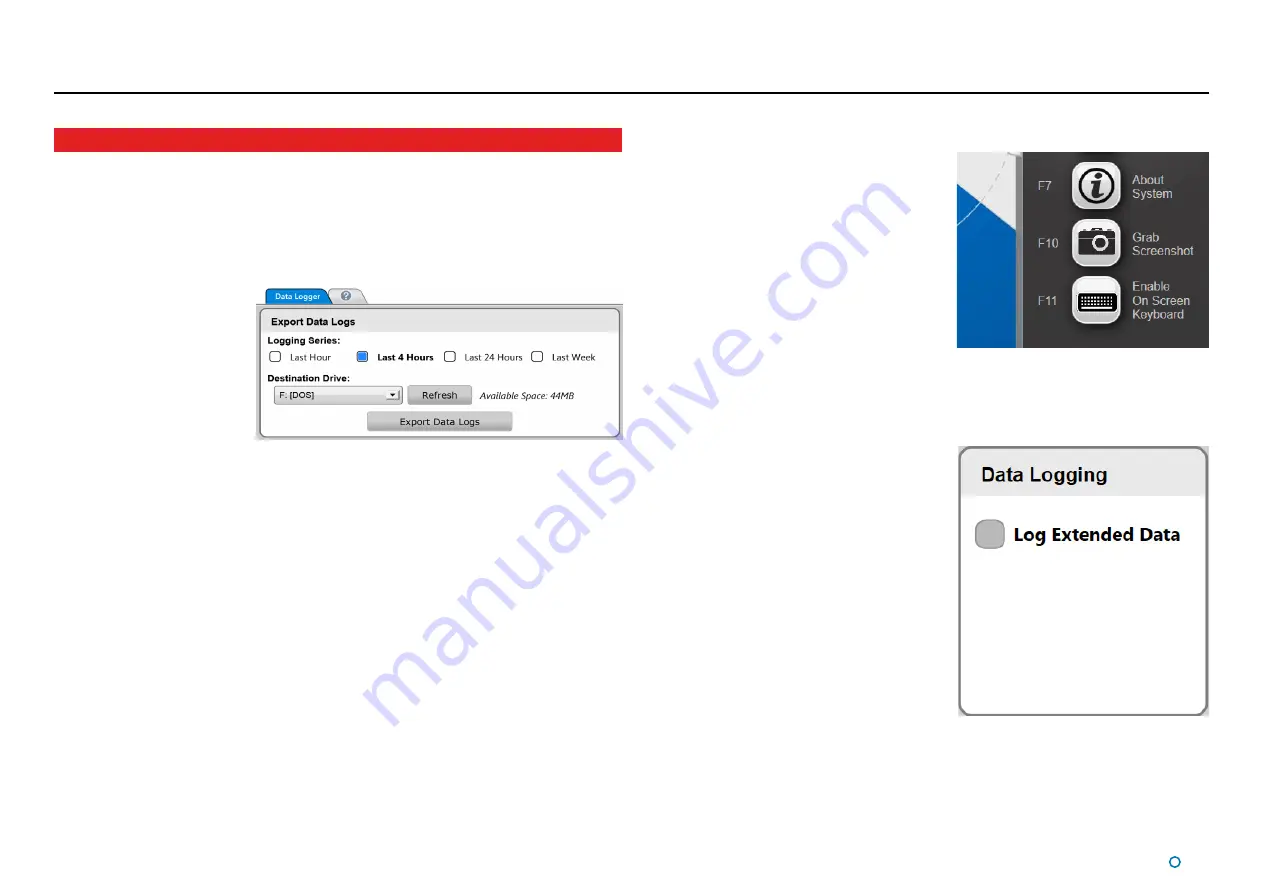
To Export Data Logs
1. Insert a USB or other
removable drive into the
Dashboard computer.
2. Navigate to
Advanced > Data Logger
.
3. Select the period for which you wish to export logs (
Last Hour
,
Last 4 Hours
, etc).
4. Select destination drive from the drop-down list, if not already displayed (click on the
Refresh
button to refresh the list of available USB drives).
5. Click on
Export Data Logs
.
Either before or during the export operation, the
Refresh
button can be used to update the
Available Space field.
Extended Data Logging
When the Log Extended Data box is ticked, extra
information will be included in all data logs that
are recorded. This may be useful as a short-term
measure for diagnosing a particular problem,
but in general the box should be left un-ticked in
order to conserve disk space.
To Enable
Extended Data Logging:
•
1. Navigate to Advanced > Data Logger.
2. Tick the Log Extended Data box.
This is for
Ethernet
connected sensor Data Logging only.
Summary of Contents for CyScan AS
Page 62: ......


