Osicus User Guide V8
09/09/2021
Page
33
of
46
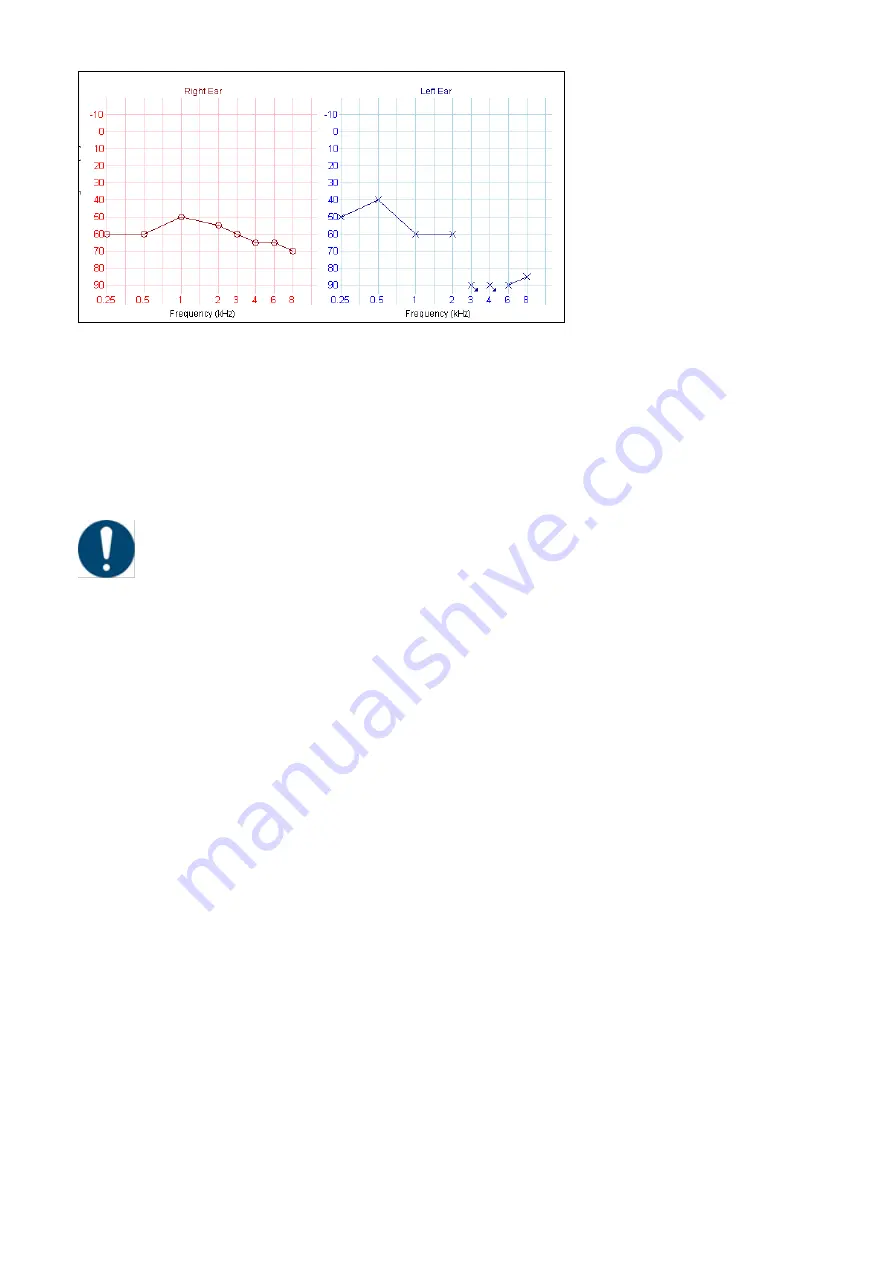
As the test proceeds, points are plotted on the au
diogram, representing the test subject’s results.
The above shows an example of audiograms for the left and right ears. The left ear audiogram is
blue and points are plotted using crosses. The right ear audiogram is red with points plotted using
circles. No response to a frequency is plotted at 90 dBHL (maximum amplitude) and the symbol
includes an arrow pointing down. This is shown above at 3 and 4 kHz on the left ear.
At the end of the test, press the button to calculate the HSE categories.
Depending on the circumstances caution is recommended in discussing audiogram results
and HSE Categories with subjects.
User comments can be added by typing in the User Comments box. These can relate to any
observations during the test and will be printed on the audiograms.
The results must be saved to the database before exiting the test window. Results can be saved by
pressing the Save button. The audiograms and related information can be printed as a report by
pressing the Print button.
8.7 Comparison of Audiograms
To compare the selected audiogram with another, click the
Compare Audiograms
tab at the bottom of the
testing window. A further window will open to allow you to select the audiogram to be compared with the
previously selected one. Highlight the one you want and then click on the Select button. Both will then be
shown superimposed. And can be toggled on/off using the tick box at the side of the test window.
8.8 Printing Audiograms
When you choose to print audiograms, a new window will open with a print preview of the report
including any related personnel and test data. From this window you can choose to print the
document to a selected printer, save the document to file or zoom in and out of the document.


