2.10
History
The
History
screen is used to display operating data for the panel over time. The historical data of the panel is
divided across five tabs, as detailed in the sections below.
2.10.1
Bottom Menu Navigation
The detail and format of the data displayed in the
RT-Trend
,
Chart
and
Annunciations
tabs may be customized
using the buttons arranged in the bottom row of the screen. The buttons displayed differ depending on the cur-
rent tab. While in the
RT-Trend
tab, the buttons appear in the arrangement shown below.
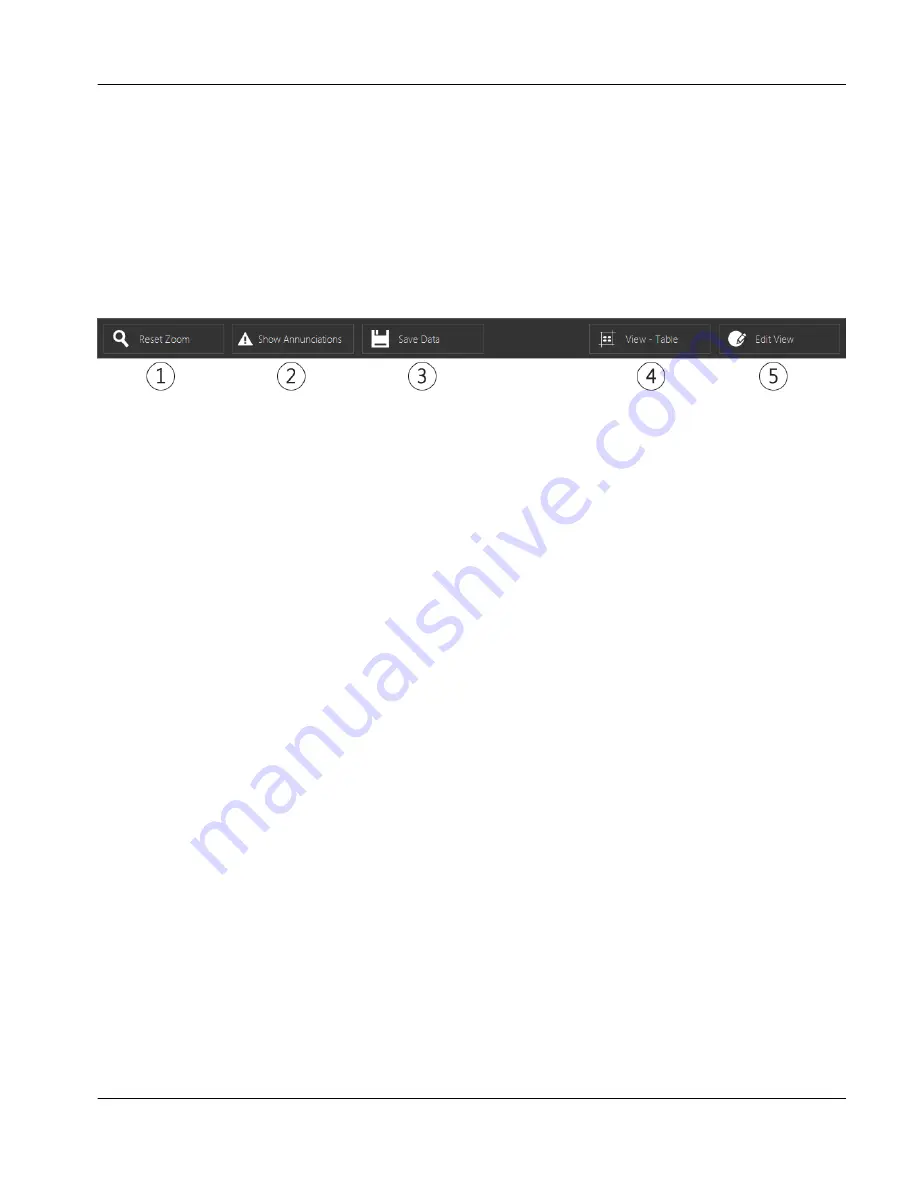
fig.59:
The RT Trend button display
From left to right, the buttons are:
1.
Reset Zoom
When viewing data within a graph, the user may zoom in and out to better view the information. This
button resets the viewing pane back to the default zoom. Zooming is controlled through pinch and zoom
functionality.
2.
Show Annunciations
This button is used to toggle whether annunciation conditions are displayed in historical graphs displays.
It is only enabled as long as the data is being displayed in graph view. When this button is clicked, verti-
cal lines will be added to the display, which correspond to any annunciations that have been triggered
during the time period represented on the graph. After the button has been clicked, the text will change
to
Hide Annunciations
. Touching the button a second time will remove the annunciation lines and change
the text back to
Show Annunciations
.
3.
Save Data
This button is used to save the current range of
RT-Trend
data displayed in the graph. Clicking it will
save a snapshot of the current ten minute interval in table format. These snapshots may be accessed
from the annunciation tab, as detailed in Section 2.10.4, Page 66.
4.
View - Table
This button is used to toggle how the historical data is displayed on screen. It is only enabled in the
RT-
Trend
and
Chart
tabs. Touching the button will cause the data to be displayed in table format, with rows
corresponding to the time increments and columns corresponding to the values that are being monitored.
As long as the data is displayed in table mode, the text on the button will instead read
View - Graph
,
which will return the display to the graphical display and change the text back to
View - Table
when
clicked.
5.
Edit View
This button is used to customize what data is displayed in the
RT-Trend
,
Chart
and
Annunciations
tabs.
Touching the button will display the screen shown below.
Instruction Manual | GEA Omni™
Control panel
User interface
History
GEA Refrigeration North America, Inc. | E_806550_2 | Generated 12.01.2016
61
Summary of Contents for Omni
Page 1: ...Control panel GEA Omni Instruction Manual E_806550_2 ...
Page 238: ......


