GE
D
IRECTION
FQ091019, R
EVISION
2
V
IVID Q
N S
ERVICE
M
ANUAL
Chapter 7 - Diagnostics/Troubleshooting
7-3
7-2-3
Accessing the Diagnostic Test Window
The diagnostic tools are accessed from 2D-Mode by simultaneously pressing
<ALT+Config>
on the
alphanumeric keyboard. The
Diagnostic
Test
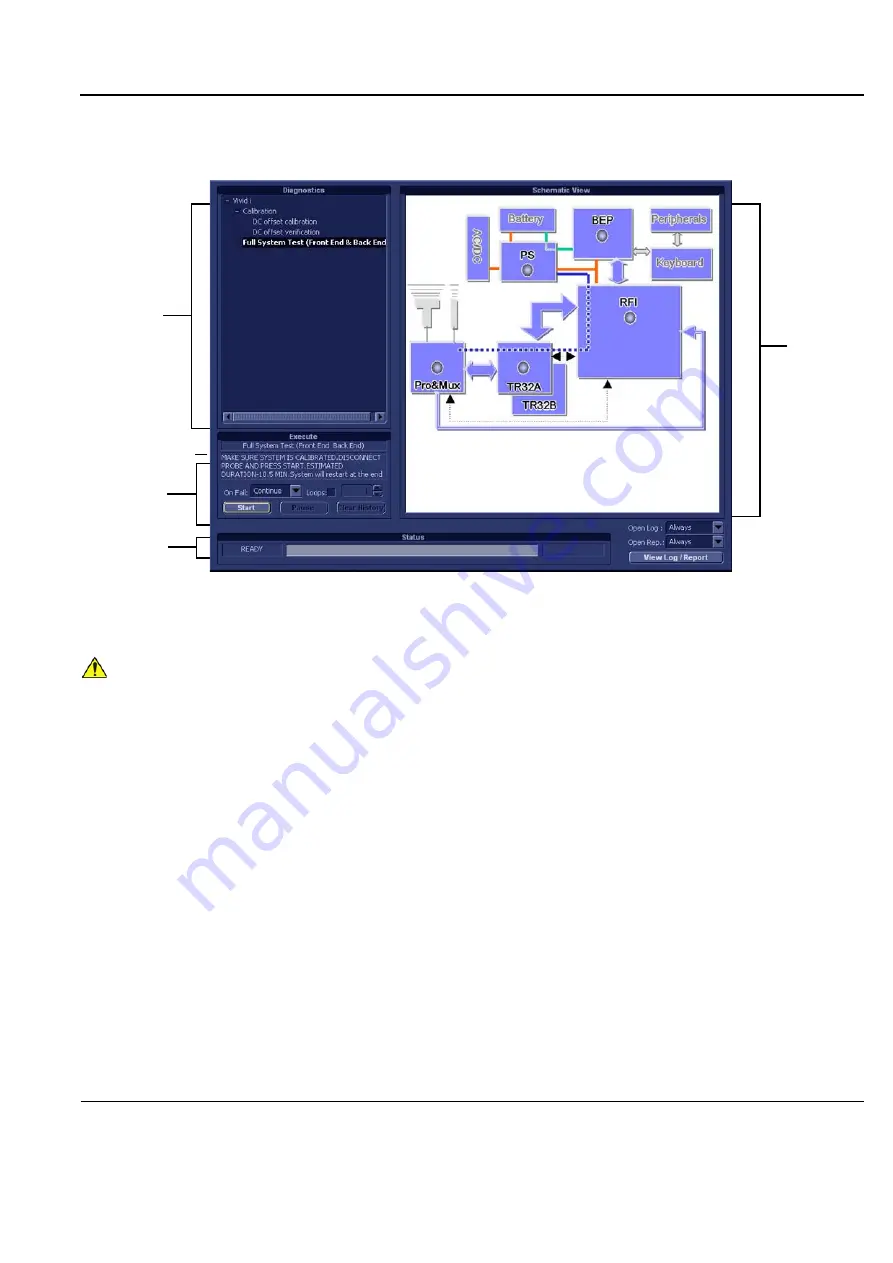
window is displayed, as shown below:
Figure 7-1 Diagnostic Test Window
NOTICE
IMPORTANT
- The user-friendly Diagnostic Test Window displays dynamically-updated information.
The Data Flow Map area on the right is designed to provide an instant visual representation of the system
components; the color illumination of graphic buttons (light blue; light gray) and status indicators (green;
red; yellow) indicates which component, or set of components, is currently undergoing diagnostic testing
(see the examples in
In this way, it is easy to visually follow the test sequence and progress of a specific test.
For a detailed explanation of the Diagnostic Test Window, refer to
Data Flow
Diagnostic
Status Area
Current Test
Test
Tree
Controls &
Map
Instructions
Special


