CB Watch 3 User Manual
v6.3 - May 2019
Page 40 of 100
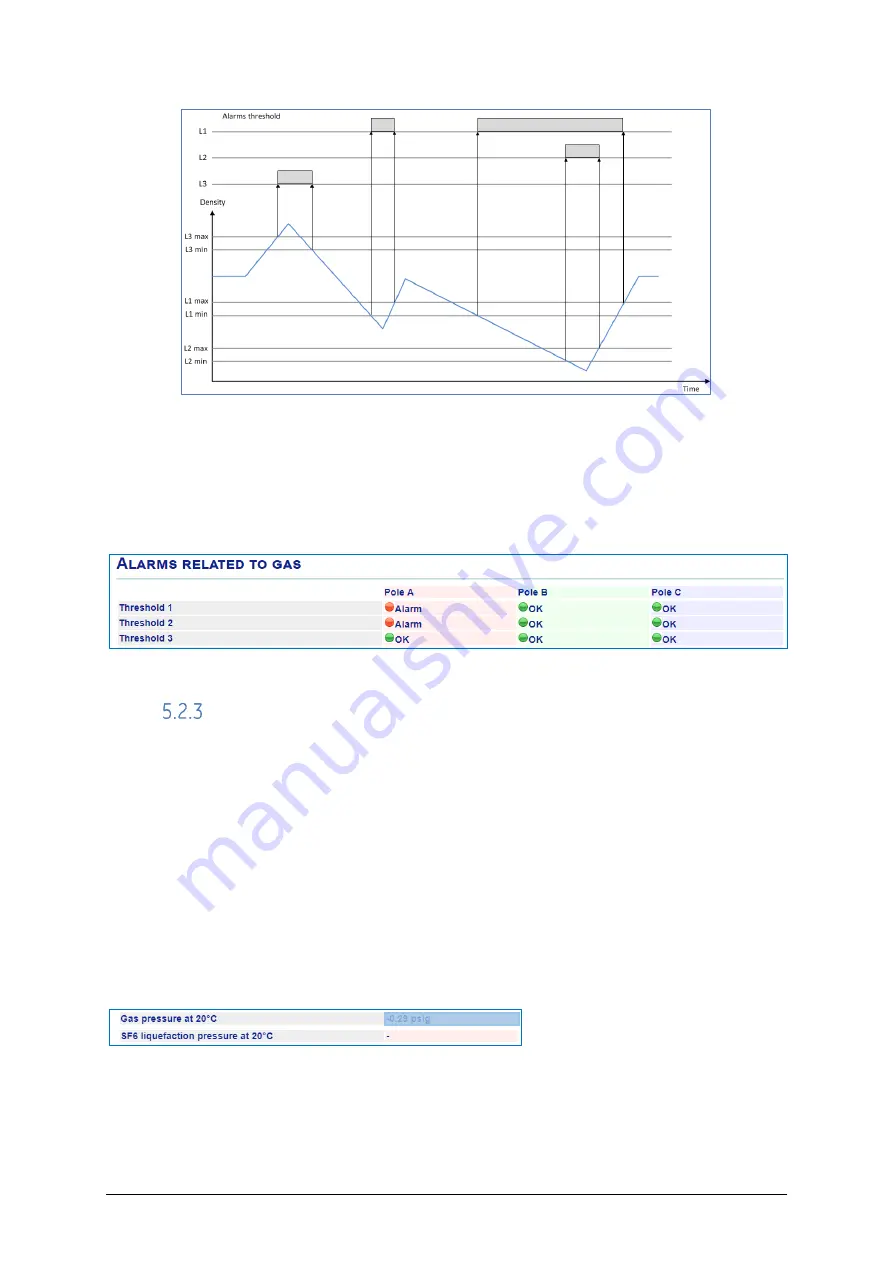
Figure 51
–
Gas thresholds
A comparison is constantly made between the current gas pressure value normalised at
20
o
C and the various thresholds (1, 2, 3) values set. If any is reached, then a threshold
alarm is raised.
HMI: Measurements/Alarms
Figure 52
–
Gas alarms
Gas liquefaction risk
As seen in the graphs at the beginning of this section, the liquefaction curve indicates at
which temperature and pressure the SF6 gas will change from gas phase to liquid phase.
At normal ambient temperature, the liquefaction pressure is very high and is not a
problem, but the curve drops rapidly, so that the liquefaction pressure gets closer to our
operating pressure range when the temperature falls below freezing.
Therefore, if the gas temperature falls below 3
o
C (37.4
o
F), the liquefaction pressure for the
gas (or gas mixture) at 20
o
C is displayed so that it can be compared to the current gas
pressure at 20
o
C
. Until the gas temperature reaches that point, a “
-
“ value is displayed as
it is not relevant to display it.
HMI: Measurements/Gas
Figure 53
–
gas liquefaction pressure
If the current gas pressure value normalised at 20
o
C falls below the known liquefaction
pressure for the gas at 20
o
C, then a liquefaction risk alarm is raised.


