6.2.6
Summary
Description
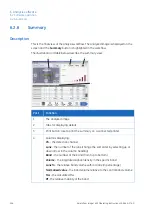
This is the final view of the analysis workflow. The analyzed image is displayed on the
screen and the Summary button is highlighted in the workflow.
The illustration and table below describe the summary view.
1
2
3
4
Function
Part
The analyzed image
1
Tabs for displaying details.
2
Print button: Use to print the summary on a connected printer.
3
Columns displaying:
4
Ch. - the detection channel
Lane - the number of the lane (change the sort order by selecting up or
down arrow in the column heading)
Band - the number of the band (from top to bottom)
Volume - the integrated signal intensity in the specific band
Lane% - the relative band volume within a lane (in percentage)
Normalized value - the band volume relative to the control band volume
Mw - the calculated Mw
Rf - the relative mobility of the band
204
Amersham Imager 600 Operating Instructions 29-0645-17 AD
6 Analysis software
6.2 Software operation
6.2.6 Summary


