background image

An indicator for a tide station appears on the chart as a vertical 

bar graph with an arrow. A red arrow pointing downward 

indicates a falling tide, and a blue arrow pointing upward 

indicates a rising tide. When you move the cursor over the tide 

station indicator, the height of the tide at the station appears 

above the station indicator.
Current direction indicators appear as arrows on the chart. The 

direction of each arrow indicates the direction of the current at a 

specific location on the chart. The color of the current arrow 

indicates the range of speed for the current at that location. 

When you move the cursor over the current direction indicator, 

the specific current speed at the location appears above the 

direction indicator.

Color

Current Speed Range

Yellow

0 to 1 knot

Orange

1 to 2 knots

Red

2 or more knots

Showing Tides and Current Indicators

NOTE: 

This feature is available with premium charts, in some 

areas.
You can show static or animated tide and current station 

indicators on the Navigation chart or Fishing chart.

1

From the Navigation or Fishing chart, select 

MENU

 > 

Layers 

Chart

 > 

Tides & Currents

.

2

To show animated tide station indicators and animated 

current direction indicators on the chart, select 

Animated

.

Showing Satellite Imagery on the Navigation Chart

NOTE: 

This feature is available with premium charts, in some 

areas.
You can overlay high-resolution satellite images on the land or 

on both land and sea portions of the Navigation chart.

NOTE: 

When enabled, high-resolution satellite images are 

present only at lower zoom levels. If you cannot see high-

resolution images in your optional chart region, you can select 

to zoom in. You also can set the detail level higher by changing 

the map zoom detail.

1

From the Navigation chart, select 

MENU

 > 

Layers

 > 

Chart

 > 

Satellite Photos

.

2

Select an option:
• Select 

Land Only

 to show standard chart information on 

the water, with photos overlaying the land.

NOTE: 

This setting must be enabled to view Standard 

Mapping

®

 charts.

• Select 

Photo Map Blend

 to show photos on both the 

water and the land at a specified opacity. Use the slider 

bar to adjust the photo opacity. The higher you set the 

percentage, the more the satellite photos cover both land 

and water.

Viewing Aerial Photos of Landmarks

Before you can view aerial photos on the Navigation chart, you 

must turn on the Photo Points setting in the chart setup (

Chart 

Layers

, page 9

).

NOTE: 

This feature is available with premium charts, in some 

areas.
You can use aerial photographs of landmarks, marinas, and 

harbors to help orient yourself to your surroundings or to 

acquaint yourself with a marina or a harbor prior to arrival.

1

From the Navigation chart, select a camera icon:
• To view an overhead photo, select 

.

• To view a perspective photo, select 

. The photo was 

taken from the location of the camera, pointed in the 

direction of the cone.

2

Select 

Photo

.

Automatic Identification System

The Automatic Identification System (AIS) enables you to 

identify and track other vessels, and alerts you to area traffic. 

When connected to an external AIS device, the chartplotter can 

show some AIS information about other vessels that are within 

range, that are equipped with a transponder, and that are 

actively transmitting AIS information.
The information reported for each vessel includes the Maritime 

Mobile Service Identity (MMSI), location, GPS speed, GPS 

heading, time that has elapsed since the last position of the 

vessel was reported, nearest approach, and time to the nearest 

approach.
Some chartplotter models also support Blue Force Tracking. 

Vessels being tracked with Blue Force Tracking are indicated on 

the chartplotter with a blue-green color.

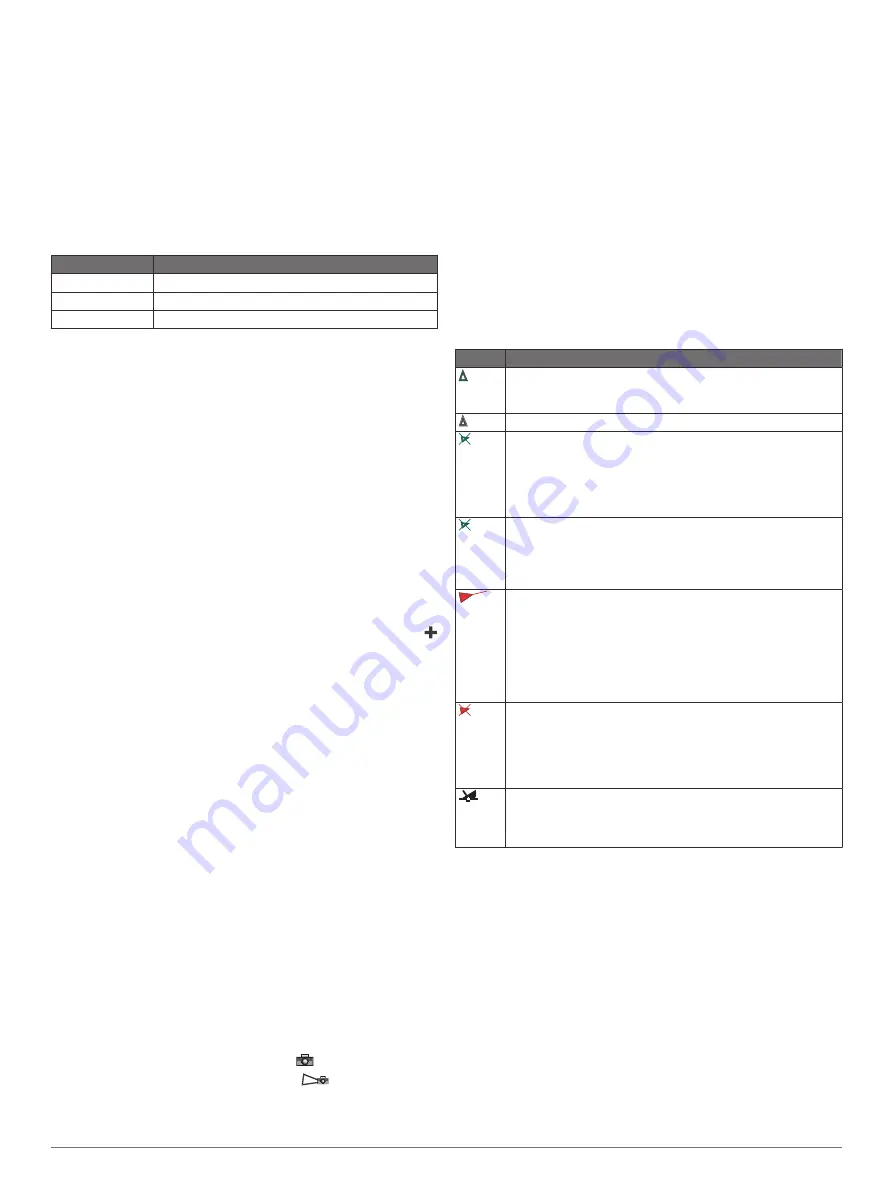
AIS Targeting Symbols

Symbol Description

AIS vessel. The vessel is reporting AIS information. The 
direction in which the triangle is pointing indicates the 
direction in which the AIS vessel is moving.
Target is selected.
Target is activated. The target appears larger on the chart. A 
green line attached to the target indicates the heading of the 
target. The MMSI, speed, and direction of the vessel appear 
beneath the target, if the details setting has been set to Show. 
If the AIS transmission from the vessel is lost, a message 
banner appears.
Target is lost. A green X indicates that the AIS transmission 
from the vessel is lost, and the chartplotter displays a 
message banner asking whether the vessel should continue 
to be tracked. If you discontinue vessel tracking, the lost 
target symbol disappears from the chart or the 3D chart view.
Dangerous target in range. The target flashes while an alarm 
sounds and a message banner appears. After the alarm has 
been acknowledged, a solid red triangle with a red line 
attached to it indicates the location and the heading of the 
target. If the safe-zone collision alarm has been set to Off, the 
target flashes, but the audible alarm does not sound and the 
alarm banner does not appear. If the AIS transmission from 
the vessel is lost, a message banner appears.
Dangerous target is lost. A red X indicates that the AIS 
transmission from the vessel is lost, and the chartplotter 
displays a message banner asking whether the vessel should 
continue to be tracked. If you discontinue vessel tracking, the 
lost dangerous target symbol disappears from the chart or the 
3D chart view.
The location of this symbol indicates the closest point of 
approach to a dangerous target, and the numbers near the 
symbol indicate the time to the closest point of approach to 
that target.

NOTE: 

Vessels being tracked with the Blue Force Tracking 

feature are indicated with a blue-green color regardless of their 

status.

Heading and Projected Course of Activated AIS 

Targets

When heading and course over ground information are provided 

by an activated AIS target, the heading of the target appears on 

a chart as a solid line attached to the AIS target symbol. A 

heading line does not appear on a 3D chart view.
The projected course of an activated AIS target appears as a 

dashed line on a chart or a 3D chart view. The length of the 

projected course line is based on the value of the projected 

heading setting. If an activated AIS target is not transmitting 

speed information, or if the vessel is not moving, a projected 

course line does not appear. Changes in the speed, course over 

ground, or rate of turn information transmitted by the vessel can 

impact the calculation of the projected course line.

Charts and 3D Chart Views

7

Summary of Contents for ECHOMAP UHD

Page 1: ...ECHOMAP UHD Owner sManual...

Page 2: ...AP Fusion Link Garmin ClearV Garmin Connect Garmin Express Garmin Quickdraw GXM HomePort LiveScope OneChart and Panoptix are trademarks of Garmin Ltd or its subsidiaries These trademarks may not be us...

Page 3: ...ture 11 Adding a Label to a Garmin Quickdraw Contours Map 11 Garmin Quickdraw Community 11 Connecting to the Garmin Quickdraw Community with ActiveCaptain 11 Connecting to the Garmin Quickdraw Communi...

Page 4: ...ion Settings 28 Autopilot 29 Autopilot Configuration 29 Autopilot Screen 29 Adjusting the Step Steering Increment 29 Setting the Power Saver 29 Selecting the Preferred Heading Source 29 Engaging the A...

Page 5: ...Water Temperature Offset 39 Calibrating a Water Speed Device 39 Setting the Fuel Capacity of the Vessel 39 Synchronizing the Fuel Data with the Actual Vessel Fuel 39 Communications Settings 39 NMEA 01...

Page 6: ......

Page 7: ...when held MENU Opens a menu of options for the page when applicable Closes a menu when applicable Takes a screenshot when held ECHOMAP UHD 60 Connector View POWER Power and data sharing1 N2K NMEA 2000...

Page 8: ...lotter 2 Insert the memory card 3 Press the card in until it clicks 4 Clean and dry the gasket and door NOTICE To prevent corrosion be sure the memory card gasket and door are thoroughly dry before cl...

Page 9: ...color settings 2 Select an option Changing the Background Image 1 From the home screen select MENU Background TIP You can also adjust this setting from Settings System Display Background 2 Select an i...

Page 10: ...ice When you reconnect the app to the ECHOMAP UHD device the update is transferred to the device After the transfer is complete you are prompted to install the update 3 When you are prompted by the EC...

Page 11: ...s spot soundings as depicted on the original paper chart navigational aids and symbols obstructions and cable areas Measuring a Distance on the Chart 1 From a chart select a location 2 Select Measure...

Page 12: ...That data does not ensure obstacle and bottom clearance Carefully compare the course to all visual sightings and avoid any land shallow water or other obstacles that may be in your path NOTE Not all m...

Page 13: ...ormation about other vessels that are within range that are equipped with a transponder and that are actively transmitting AIS information The information reported for each vessel includes the Maritim...

Page 14: ...played on the charts and have identifying information such as position and type There are three main kinds of AIS ATONs Real ATONs physically exist and send their identifying and location information...

Page 15: ...Data Layer Settings page 10 Other Vessels Adjusts how other vessels are shown Other Vessels Layer Settings page 10 Water Shows and hides depth items Water Layer Settings page 10 Quickdraw Contours Sho...

Page 16: ...depth soundings and simplifies map presentation for optimal use while fishing Relief Shading Shows the gradient of the bottom with shading This feature is available only with some premium maps Sonar...

Page 17: ...community Downloading Garmin Quickdraw Community Maps Using ActiveCaptain page 11 and share the contours you have created Sharing Your Garmin Quickdraw Contours Maps with the Garmin Quickdraw Communit...

Page 18: ...on and a speed between 16 and 32 km h 10 and 20 mph Red indicates poor depth or GPS position and a speed above 32 km h 20 mph Navigation with a Chartplotter WARNING All route and navigation lines disp...

Page 19: ...rrected course from your current location to the destination The corrected course is dynamic and it moves with your boat when you are off course 3 Follow the magenta line steering to avoid land shallo...

Page 20: ...ing a Waypoint or an MOB 1 Select Nav Info Waypoints 2 Select a waypoint or an MOB 3 Select Delete Deleting All Waypoints Select Nav Info Manage Data Clear User Data Waypoints All Routes A route is a...

Page 21: ...e WARNING The Auto Guidance feature is based on electronic chart information That data does not ensure obstacle and bottom clearance Carefully compare the course to all visual sightings and avoid any...

Page 22: ...of the Auto Guidance line and determine whether the line safely avoids known obstacles and the turns enable efficient travel 6 Select an option If the placement of the Auto Guidance line is satisfacto...

Page 23: ...ed on a distance between points select Interval Distance Change and enter the distance To record the track based on a time interval select Interval Time Change and enter the time interval To record th...

Page 24: ...t is moving at an optimal speed to reach the start line when the timer expires By default the start line guidance window and the race timer window appear in the Sail Racing combination screen Setting...

Page 25: ...onsible for the sails while the autopilot is engaged In addition to heading hold you can use the autopilot to maintain a wind hold You can also use the autopilot to control the rudder while tacking an...

Page 26: ...window to change 3 Select a sonar view Traditional Sonar View There are several full screen views available depending on the transducer that is connected The full screen Traditional sonar view shows...

Page 27: ...he transducer To see all five Panoptix sonar views you need one transducer to show the down views and a second transducer to show the forward views To access the Panoptix sonar views select Panoptix a...

Page 28: ...h information Suspended targets or fish Bottom of the body of water Flasher View The flasher shows sonar information on a circular depth scale indicating what is beneath your boat It is organized as a...

Page 29: ...able sonar view for the source For example to rename the Garmin ClearV sonar source you must open the Garmin ClearV sonar view 1 From the sonar view select MENU Sonar Setup Source Rename Sources 2 Ent...

Page 30: ...d Range Lines Shows the vertical lines indicating the distance to the right and left of the boat This setting is available for SideV sonar view Color Scheme Sets the color scheme of the sonar view Thi...

Page 31: ...n the depth in front of the vessel is less than the specified value which can help you avoid running aground Setting the FrontV Depth Alarm page 27 This alarm is available only with Panoptix FrontV tr...

Page 32: ...w showing you what is underneath the transducer right now You can use the a scope to identify target returns that may be missed when the sonar data is quickly scrolling across the screen such as when...

Page 33: ...e bottom brown to distinguish it from the water returns Grid Overlay Shows a grid of range lines Scroll History Shows the sonar history in a traditional sonar view RealV Appearance Settings From a Rea...

Page 34: ...sonar views Beam Width Sets the width of the down view Panoptix transducer beam Narrow beam widths allow you to see deeper and farther Wider beam widths allow you to see more coverage area This appli...

Page 35: ...stem must be configured to work properly with your boat You can configure the autopilot using a chartplotter on the same NMEA 2000 network as the autopilot For configuration instructions go to support...

Page 36: ...message 5 On the chartplotter select Yes to complete the pairing process Changing the Functions of the Reactor Autopilot Remote Control Action Keys You can change the patterns or actions assigned to t...

Page 37: ...ld mode The Vessel Align option attempts to keep the boat pointing in the same direction regardless of drift The Navigate To option attempts to navigate a straight line in the requested direction Arri...

Page 38: ...ation Every position report call received is logged in the DSC list DSC List page 32 Viewing a Position Report 1 Select Nav Info Other Vessels DSC List 2 Select a position report call 3 Select an opti...

Page 39: ...Select the number of engines Select Auto Configure to automatically detect the number of engines Customizing the Engines Shown in Gauges Before you can customize how the engines are shown in the gauge...

Page 40: ...ing range select Rated Max To set the lower limit of the gauge lower than the rated minimum select Scale Min To set the upper limit of the gauge higher than the rated maximum select Scale Max 5 Select...

Page 41: ...have multiple media devices connected on a network such as the NMEA 2000 network you can select the media source you want to control from your chartplotter NOTE You can play media only from sources th...

Page 42: ...select countries only you must also set the tuner region to a location where DAB signals are broadcast 1 Select the DAB source 2 Select Scan to scan for available DAB stations When scanning is complet...

Page 43: ...sscode the parental controls must be unlocked 1 From the media screen select Browse Parental Change PIN 2 Enter your passcode and select Done 3 Enter a new passcode 4 Confirm the new passcode Restorin...

Page 44: ...ngs as well as applicable product and licensing information Not available on all models 1 Select Settings 2 Select System 3 Select Regulatory Information My Vessel Settings NOTE Some settings and opti...

Page 45: ...is not registering a speed a message appears 3 Select OK and safely increase the boat speed 4 If the message appears again stop the boat and ensure the speed sensor wheel is not stuck 5 If the wheel...

Page 46: ...vices to the chartplotter to share data 1 From the wireless device turn on the Wi Fi technology and search for wireless networks 2 Select the name of your chartplotter wireless network Setting Up the...

Page 47: ...r software updates To clear saved data and reset device settings to the factory default values disconnect the chartplotter from the Garmin Marine Network and select Delete Data and Reset Settings This...

Page 48: ...o any location on the computer Restoring Backup Data to a Chartplotter 1 Insert a memory card into a card reader that is attached to the computer 2 Copy a backup file from the computer to the memory c...

Page 49: ...r your device When you add devices to the chartplotter network repeat these steps to register the new devices using the Garmin Express app Updating Your Charts Using the Garmin Express App This device...

Page 50: ...which is very sensitive to waxes and abrasive cleaners 1 Apply an eyeglass lens cleaner specified as safe for anti reflective coatings to the cloth 2 Gently wipe the screen with a soft clean lint fre...

Page 51: ...X7 The device withstands incidental exposure to water of up to 1 m for up to 30 min For more information go to www garmin com waterrating Temperature range From 15 to 55 C from 5 to 131 F Input voltag...

Page 52: ...ectronics Association NMEA format and sentences from www nmea org 1 Dependent upon the transducer 2 Dependent upon the transducer rating and depth 3 Dependent upon the transducer water salinity bottom...

Page 53: ...turning on 32 41 digital switching 34 display settings 38 distress call 32 distress signal device 8 DSC See digital selective calling E EGNOS 38 engine gauges 33 34 configuring 33 status alarms 33 EP...

Page 54: ...FrontV 22 gain 23 Garmin ClearV 20 interference 25 measuring distances 23 noise 23 25 numbers 3 overlay numbers 24 Panoptix 21 22 26 27 Panoptix LiveScope 28 picture advance 25 recording 24 scroll spe...

Page 55: ...support garmin com TA 2018 183 TA 2018 209 TA 2018 154 GUID 0D15DF1D FE0A 4101 9423 8240088D45C2 v3 February 2021...

Page 56: ...tting always check what is on the opposite side of the surface to avoid damaging the vessel Read all installation instructions before proceeding with the installation If you experience difficulty duri...

Page 57: ...cables to the cradle Connection Considerations page 3 Fixed Bail Mounting the Device NOTICE If you are mounting the bracket on fiberglass with screws it is recommended to use a countersink bit to dril...

Page 58: ...The connected cables are held in place by a locking bracket 1 Slide the cable locking bracket up from the bottom and remove the bracket from the cradle 2 Compare the divots on each cable connector to...

Page 59: ...6 and connect the devices following the instructions included with the cable 3 On both devices select Nav Info Manage Data User Data Sharing User data is shared between the connected devices If you se...

Page 60: ...r of up to 1 m for up to 30 min For more information go to www garmin com waterrating 2 NMEA 2000 is available on ECHOMAP UHD 7x 9x models Display size W x H 15 5 x 8 6 cm 6 1 x 3 4 in 17 8 cm 7 in di...

Page 61: ...d speed GPWPL WPL Waypoint location GPXTE XTE Cross track error PGRME E Estimated error PGRMM M Map datum PGRMZ Z Altitude SDDBT DBT Depth below transducer SDDPT DPT Depth SDMTW MTW Water temperature...

Page 62: ...and wires trolling motor batteries and wires and high energy wires such as radar audio amplifier and autopilot pump wires If your transducer cable is not long enough to reach the chartplotter you can...

Page 63: ...ocation Considerations page 1 place the bottom corner of the template on the edge of the transom 4 Mark the center location of the two holes of the template 5 Remove the template from the transom 6 Wr...

Page 64: ...occurs 4 Return the boat to the speed at which the signal was lost and make moderate turns in both directions while observing the chartplotter 5 If the signal strength improves while turning adjust th...

Page 65: ...n SideV 500 W Frequency Traditional CHIRP High Wide 140 240 kHz Garmin ClearV and Garmin SideV CHIRP 455 kHz 420 490 kHz UHD CHIRP 800 kHz 770 840 kHz UHD CHIRP 1 MHz 1000 1120 kHz Maximum depth dista...

Page 66: ...bre seguran a e sobre o produto 7 Belangrijke veiligheids en productinformatie 8 Vigtige produkt og sikkerhedinformationer 9 T rkeit turvallisuus ja tuotetietoja 10 Viktig sikkerhets og produktinforma...

Page 67: ...n of the export control laws of the United States of America or the export control laws of any other applicable country Limited Warranty THIS LIMITED WARRANTY GIVES YOU SPECIFIC LEGAL RIGHTS AND YOU M...

Page 68: ...late and therefore an incorrect cutout too large or too small on the mounting surface of your boat 1 Select File Print 2 Select None for Page Scaling 3 Ensure the check mark is next to Auto Rotate and...

Page 69: ...September 2019 190 02598 05_0A Printed in Taiwan ECHOMAP UHD 9x Series 10 mm 13 32 in 3 2 mm 1 8 in 143 7 mm 5 11 16 in 250 8 mm 9 7 8 in Top...

Reviews: