13-17-621 Page 36
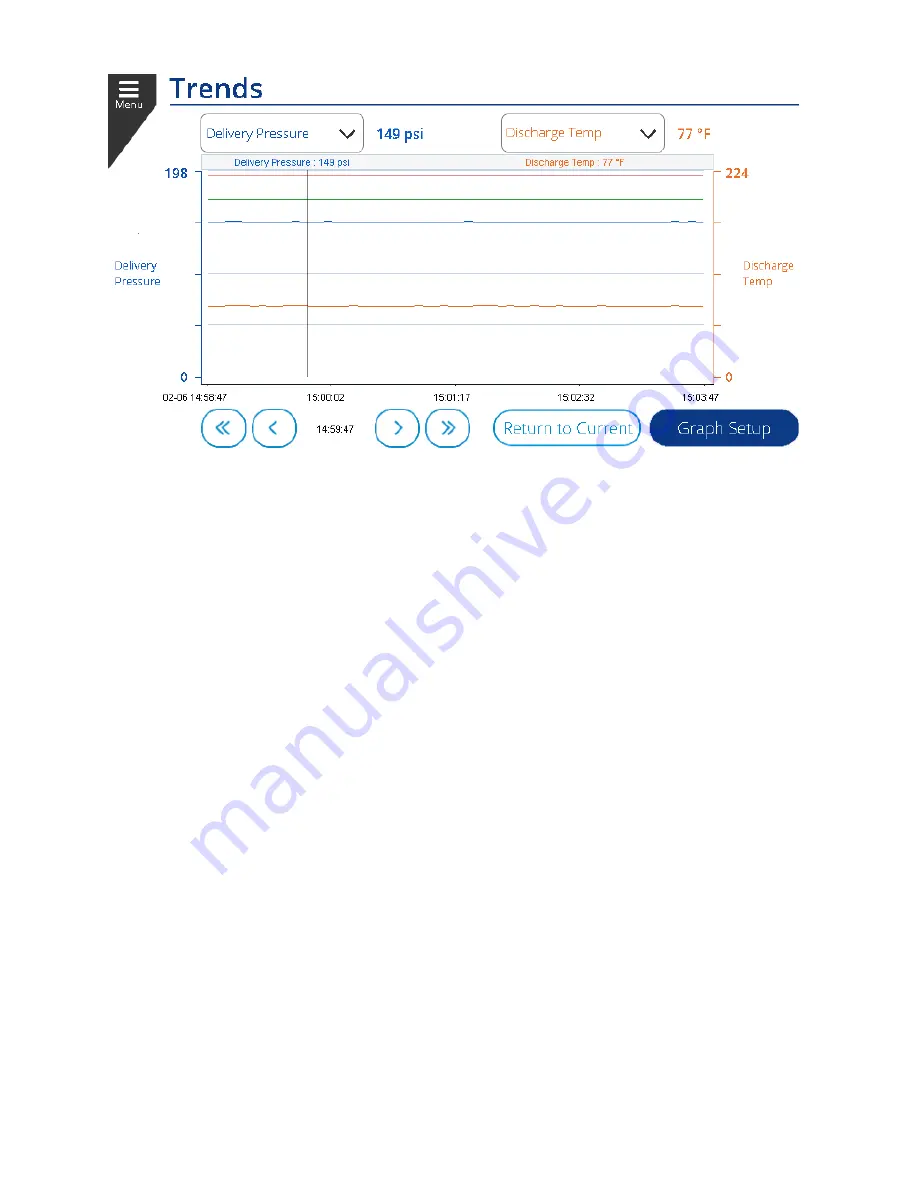
Figure 35: Trend History View
While History view is activated, you can use the arrows to scroll forward and backward in time. The black
vertical bar on the display shows the current position and the readings just above the graph show the
values at the location of the bar. Press
Return to Current
to return to the Live Data view.
Additional configuration of the graph can be done by pressing the
Graph Setup
button. This will bring up
a configuration popup as shown in Figure 36.
The upper and lower limits of each axis can be configured to change the scale of the graph.
The
Time Span
dropdown can be used to change the scale of the time axis. For example, setting
to 12 hours would scale the graph so that the full width of the window represents 12 hours of
time.
To jump to a particular date and time in history view, press the
Edit
button next to the Date / Time
and enter the date and time that you would like to view. This can be more efficient than scrolling
from the graph.
Summary of Contents for Governor
Page 37: ...13 17 621 Page 37 Figure 36 Trend Graph Setup...
Page 43: ...13 17 621 Page 43...


