
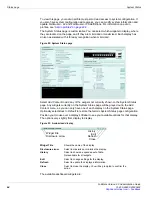


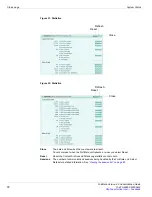


System Status
Status page
FortiGate Version 4.0 Administration Guide
01-400-89802-20090424
69
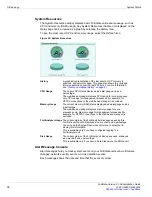
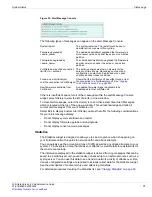
INT / EXT / DMZ / HA /
WAN1 / WAN2 / 1 / 2 /
3 / 4
The network interfaces on the FortiGate unit. The names and
number of these interfaces vary by model.
The icon below the interface name indicates its up/down status by
color. Green indicates the interface is connected. Grey indicates
there is no connection.
For more information about the configuration and status of an
interface, pause the mouse over the icon for that interface. A
tooltip displays the full name of the interface, its alias if one is
configured, the IP address and netmask, the status of the link, the
speed of the interface, and the number of sent and received
packets.
AMC-SW1/1, ...
AMC-DW1/1, ...
If your FortiGate unit supports Advanced Mezzanine Card (AMC)
modules and if you have installed an AMC module containing
network interfaces (for example, the FortiGate-ASM-FB4 contains
4 interfaces) these interfaces are added to the interface status
display. The interfaces are named for the module, and the
interface. For example AMC-SW1/3 is the third network interface
on the SW1 module, and AMC-DW2/1 is the first network interface
on the DW2 module.
AMC modules support hard disks as well, such as the ASM-S08
module. When a hard disk is installed, ASM-S08 is visible as well
as a horizontal bar and percentage indicating how full the hard
disk is.
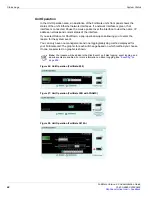
FortiAnalyzer
The icon on the link between the FortiGate unit graphic and the
FortiAnalyzer graphic indicates the status of their OFTP
connection. An ‘X’ on a red icon indicates there is no connection.
A check mark on a green icon indicates there is OFTP
communication.
Select the FortiAnalyzer graphic to configure remote logging tot he
FortiAnalyzer unit on your FortiGate unit. See
FortiAnalyzer unit” on page 650
FortiGuard Analysis
Service
The icon on the link between the FortiGate unit graphic and the
FortiGuard Analysis Service graphic indicates the status of their
OFTP connection. An ‘X’ on a red icon indicates there is no
connection. A check mark on a green icon indicates there is OFTP
communication.
Select the FortiGuard Analysis Service graphic to configure
remote logging to the FortiGuard Analysis Service. See
“FortiGuard Analysis and Management Service” on page 648
.
FortiManager
The icon on the link between the FortiGate unit graphic and the
FortiManager graphic indicates the status of the connection. An ‘X’
on a red icon indicates there is no connection. A check mark on a
green icon indicates there is communication between the two
units.
Select the FortiManager graphic to configure central management
on your FortiGate unit. See
“Central Management” on page 226
FortiGuard
Management Service
The icon on the link between the FortiGate unit graphic and the
FortiGuard Analysis and Management Service graphic indicates
the status of the connection. An ‘X’ on a red icon indicates there is
no connection. A check mark on a green icon indicates there is
communication.
Select the FortiGuard Analysis and Management Service graphic
to configure central management on your FortiGate unit. See
“Central Management” on page 226
.
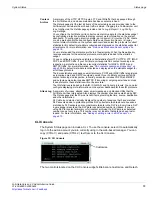
Reboot
Select to shutdown and restart the FortiGate unit. You will be
prompted to enter a reason for the reboot that will be entered into
the logs.
Shutdown
Select to shutdown the FortiGate unit. You will be prompted for
confirmation, and also prompted to enter a reason for the
shutdown that will be entered into the logs.
Summary of Contents for Gate 60D
Page 705: ...www fortinet com...
Page 706: ...www fortinet com...


