


10713303;a4
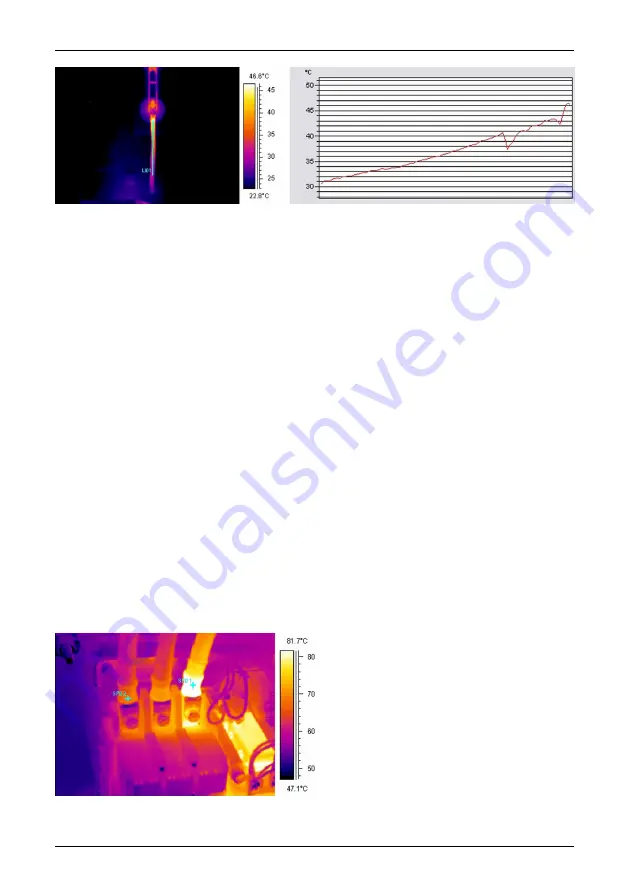
Figure 17.7 A profile (line) in an infrared image and a graph displaying the increasing temperature
17.3.4
Normal operating temperature
Temperature measurement with thermography usually gives the absolute temperature
of the object. In order to correctly assess whether the component is too hot, it is
necessary to know its operating temperature, that is, its normal temperature if we
consider the load and the temperature of its environment.
As the direct measurement will give the absolute temperature—which must be con-
sidered as well (as most components have an upper limit to their absolute tempera-
tures)—it is necessary to calculate the expected operating temperature given the load
and the ambient temperature. Consider the following definitions:
■
Operating temperature: the absolute temperature of the component. It depends
on the current load and the ambient temperature. It is always higher than the am-
bient temperature.
■
Excess temperature (overheating): the temperature difference between a properly
working component and a faulty one.
The excess temperature is found as the difference between the temperature of a
‘normal’ component and the temperature of its neighbor. It is important to compare
the same points on the different phases with each other.
As an example, see the following image taken from indoor equipment:
10713403;a4
Figure 17.8 An infrared image of indoor electrical equipment (1).
Publ. No. T559382 Rev. a358 – ENGLISH (EN) – June 23, 2009
103
17 – Introduction to thermographic inspections of electrical installations
Summary of Contents for Extech i5
Page 2: ......
Page 3: ...User s manual Publ No T559382 Rev a358 ENGLISH EN June 23 2009 ...
Page 6: ...vi Publ No T559382 Rev a358 ENGLISH EN June 23 2009 ...
Page 179: ......