


186
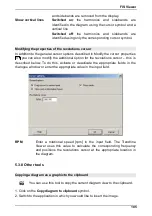
3. Select the
Paste
option from the
Edit
menu for the application or use the
shortcut
Ctrl+V
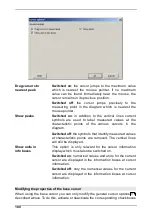
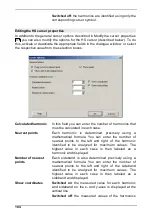
Change diagram boundaries
You can use this tool to change the minimum/maximum values
displayed on the x- and y-axis.
1. Click on the
Change diagram boundaries
symbol.
The "Modify maximum values" dialogue is displayed.
2. Enter a new minimum/maximum value for the X and/or Y axis in the appropriate
boxes. Click
Reset
to restore values automatically calculated by the Viewer.
3. Select an additional option:
o
Apply settings to the selected diagram only
: Only the diagram activated in
the signal selection (see "Displaying and removing signals"
) is changed.
o
Apply settings to all diagrams with the same axis unit
: All diagrams with
the same axis unit – e.g. "g" – are changed.
o
Apply settings to group
: All diagrams belonging to the same configuration
as the selected signal are changed.
o
Apply settings to all diagrams with the same type
: All diagrams of the
same type – e.g. "time signals" – are changed.
o
Reset all customizations of the selected diagram
: The settings for all
161