Exinda Network Orchestrator
3 Using
|
253
Monitoring edge cache reduction
The Edge Cache report shows the reduction in the amount of traffic achieved due to caching techniques and the
number of requests and the number of hits from the cache.
This report answers questions such as:
How much traffic reduction am I getting due to Edge Cache?
How cacheable is the network data and how frequently is the cache being accessed?
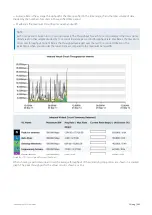
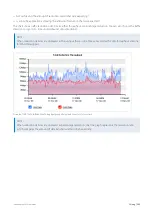
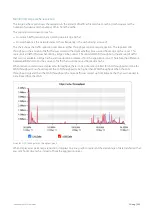
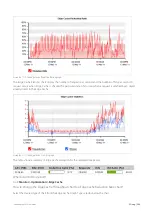
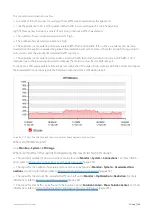
The chart shows the traffic reduction over time as either throughput or percentage reduction. The reported LAN
throughput is the amount of traffic that was served to the client whether it was served from Edge Cache or not. This
represents all traffic that was handled by Edge Cache policies. The reported WAN throughput is the amount of traffic
that was not available in Edge Cache and needed to be retrieved from the application server. Therefore, the difference
between WAN and LAN is the amount of traffic that could be served from Edge Cache.
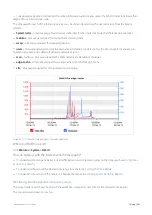
When reduction statistics are displayed as throughput, there is one time series plotted for LAN throughput and one for
WAN throughput. You should expect the LAN throughput to be higher than WAN throughput. When the LAN
throughput is greater than the WAN throughput, the more traffic was served up from Edge Cache than was needed to
be retrieved from the WAN.
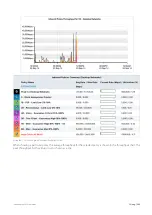
Screenshot 109: The Edge Cache Throughput graph.
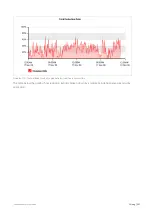
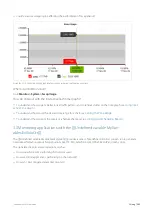
When displayed as percentage reduction, it displays one line graph to represent the percentage of data transferred that
was sent from Edge Cache instead of from the application server.
Summary of Contents for EXNV-10063
Page 369: ...Exinda Network Orchestrator 4 Settings 369 ...
Page 411: ...Exinda Network Orchestrator 4 Settings 411 Screenshot 168 P2P OverflowVirtualCircuit ...
Page 420: ...Exinda Network Orchestrator 4 Settings 420 Screenshot 175 Students OverflowVirtualCircuit ...

