0170022-J0 Rev A
Page 47
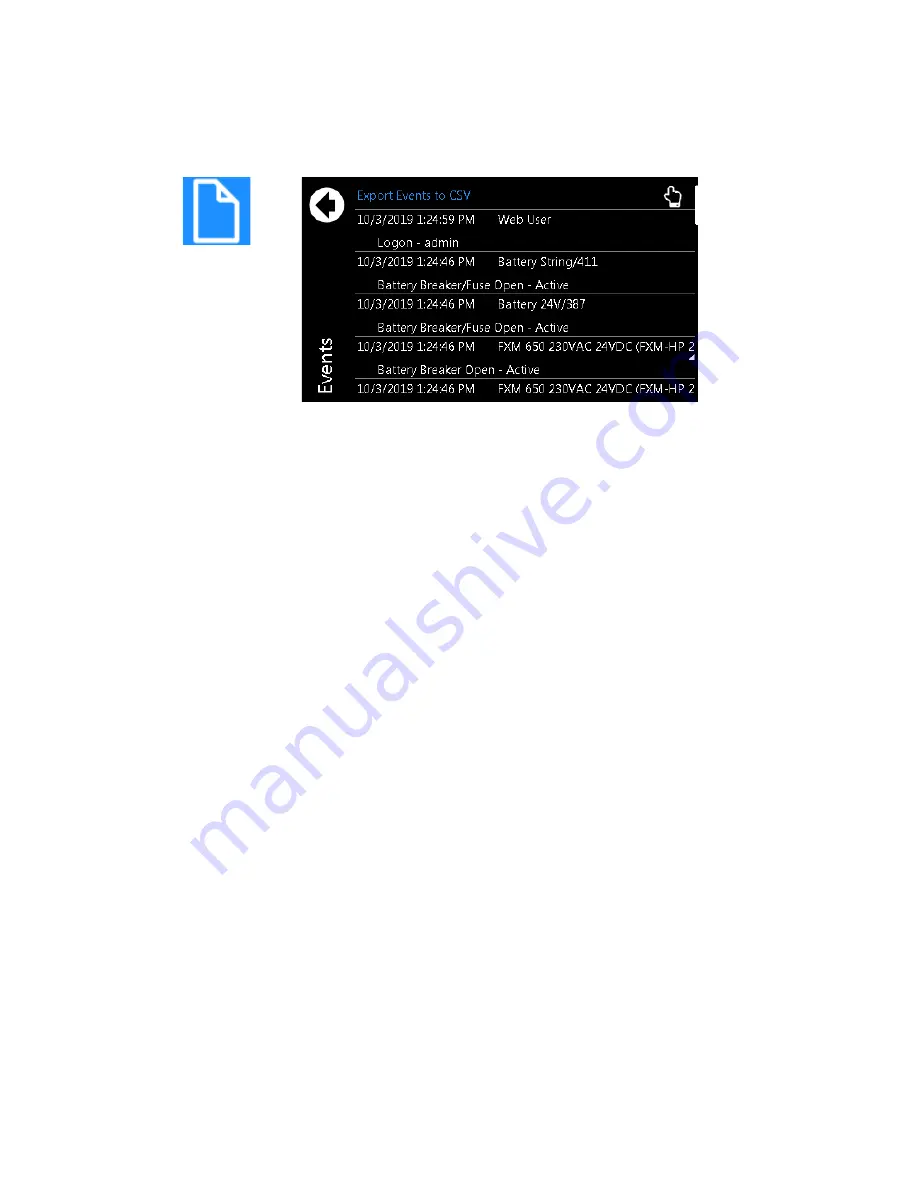
Figure 36:
Events Logs
8.1.4
Overview of the Web Interface
The dashboard is the default view displayed when you login to the controller via the web. It provides an
up-to-date overview of most critical information of your system. It displays controller information, a
system summary table, and the list of any active alarms.
The upper-left tile of the screen provides a color-coded live status view of these alarm notifications. The
upper-right tile provides a system status bar with detailed information about the system(s).
If there are active alarms, the
Alarm Notification
tile displays the last active alarm according to alarm
priority:
•
Red for major or critical alarms
•
Amber for minor alarms
•
Blue for warnings
Clicking the Alarm tile takes you directly to the
Active Alarms
menu.
The upper-right tile displays
System Status Bar(s)
which contains summary information for the
system(s). Clicking the system link at the top of the
System Status Bar(s)
takes you directly to the
System
status screen.
The upper right-side of the of the web interface also provides the
Login
and
Language
drop down
menus. From the language drop-down menu you can change the language from English to other
languages as well as choose imperial or metric measurement units for the display.
Summary of Contents for Alpha FXM HP 1100
Page 1: ...Alpha FXM HP 650 1100 2000 UPS Technical Guide 0170022 J0 Effective 11 2019...
Page 2: ......
Page 4: ......
Page 12: ...viii...
Page 28: ...0170022 J0 Rev A Page 16...
Page 30: ...0170022 J0 Rev A Page 18...
Page 142: ...0170022 J0 Rev A Page 130 Figure 70 Upgrade Succeeded...
Page 144: ...0170022 J0 Rev A Page 132...
Page 146: ...0170022 J0 Rev A Page 134...
Page 148: ......
Page 149: ......


