


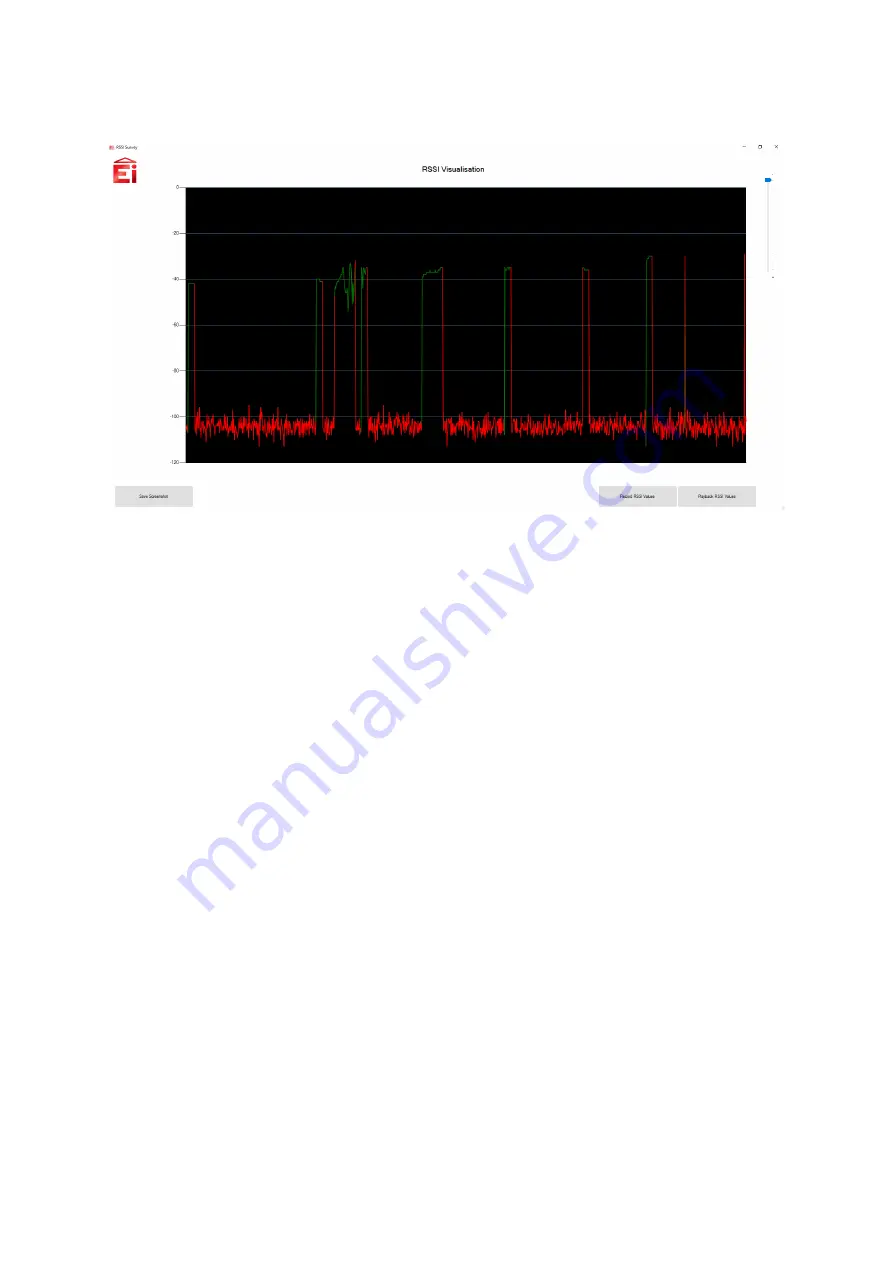
View RF Signals
This tool can be used to locate a source of interference if one is present. The scale
used is 0 to -120. 0 would be the strongest signal and -120 is the weakest.
In general, -120 to -90 means there is no source of interference. Any signals higher
than that (-90 and up) that are not green are considered sources of interference. If the
line is green, it signifies that the signal present can be decoded and is valid.
If the line is red, it signifies that the signal cannot be decoded and is a source of
interference or signal noise. Note that the green signals in the chart will only appear if
the unit is sending data that can be decoded. A high red level can indicate interference
from other RF emitting devices.
To locate the source of interference, you must move the RFTool around the area,
noting where the signals get stronger and weaker. This must be carried out until you have
effectively zeroed in on the source.
The slider at the top right allows you to zoom into the survey, allowing more
granularity into the incoming RF data. Save Screenshot will take an immediate screenshot
of the RF data at the exact point the button was pressed and allow you to save it as a
PNG
image.
Record RSSI Values
and
Playback RSSI Values
allow you to record RSSI data
into a
CSV
file, as well as play it back.
Recording RSSI Data
To Record RSSI data, press the
Record RSSI Values
button. A file save dialog will
appear, allowing you to choose a location to save the collected RSSI data. When you
are ready, press
Save
. When you have done this, the RSSI Visualization will change to
recording mode, and reset any data on the screen. To stop recording, press the
Stop
Recording
button. This will save the RSSI data to the
CSV
file.
19


