LAN Gateway Firmware V1.2
V1.8 25. April 2012
© 2012 – ECKELMANN AG | BERLINER STRASSE 161 | 65205 WIESBADEN | PHONE +49(0)611 7103-0 | FAX +49(0)611 7103-133 | eckelmann.de
20/34
4.5.5 Configuration of the trace level
The LAN gateway is equipped with a trace interface on the monitor interface. If a serial connection is
established – as described in chapter 4.2 – then trace messages are displayed on the monitor interface in
accordance with the configuration of the trace level.
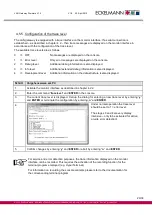
The available trace levels are as follows:
0
=> OFF
No messages are displayed on the console.
1
=> Error level
Only error messages are displayed on the console.
2
=> Debug level
Additional debug information is also displayed.
3
=> Info level
Additional extended debug information is also displayed.
4
=> Development level
Additional information on the data structure is also displayed.
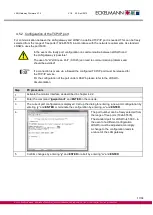
Schritt
Vorgehensweise am PC
1.
Activate the monitor interface as described in chapter 4.2.2.
2.
Enter the command “
tracelevel
“ and
ENTER
in the console.
3.
The current trace level is displayed. Call up the dialog for entering a new trace level by entering “
y
“
and
ENTER
or terminate the configuration by entering „
n
“ and
ENTER
.
4.
Under normal operation the trace level
should be set to 1 = error level.
The stages 3 and 4 are very display
intensive – only to be activated for active,
on-site error detection!
5.
Confirm changes by entering “
y
“ and
ENTER
or abort by entering “
n
“ and
ENTER
For service and error detection purposes, the trace information displayed on the monitor
interface can be recorded. This requires the activation of the recording function for the
terminal program employed (e.g. HyperTerminal).
For information on recording the console contents please refer to the documentation for
the corresponding terminal program.


