Profiler User Guide
4-16
graphs.
Let’s take a look at an example.
In this case, the orange line is your
current Profile and the green line is a
Run graph. The red circle will
automatically follow your Profile line
and the end of the handle is what you
move with the mouse to the other
point you wish to use as a reference.
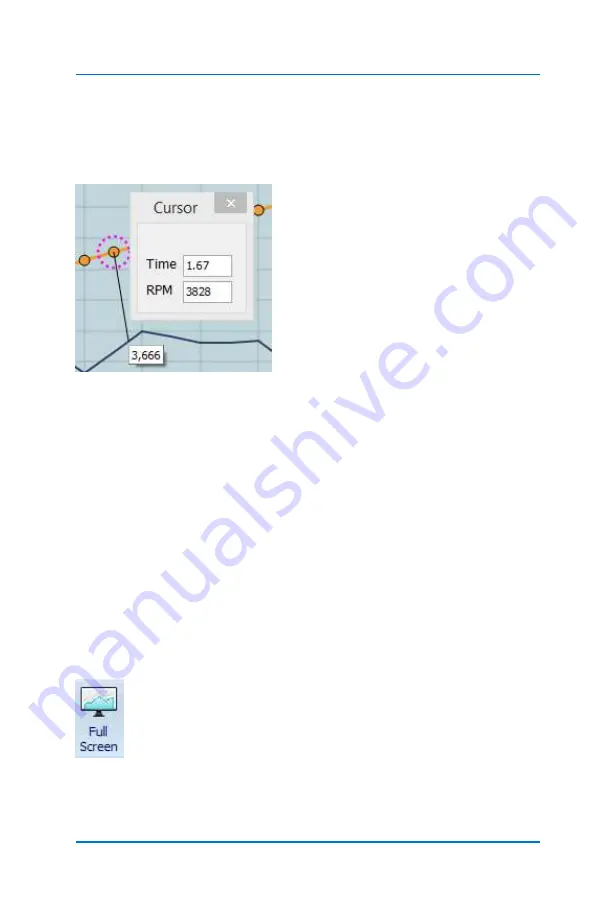
To see the difference in RPM between the current Profile at any
given point along the line and another run that is displayed, drag the
handle down to the Run line and the RPM of the Run line will pop-
up. Now you can see
both
the RPM of the Profile at that point and
another run at the same point in time.
This can be useful to know how far above or below your Profile is
from other Run lines or Profile lines that are being displayed.
4.0.2
Maximizing Screen Windows
There will times you choose to maximize the size of the Profile
window and minimize the Timing window portion of the screen.
Profile Window
With the Profile portion of the window selected, Select
>
Full Screen.
Return to normal screen size Select >
Full Screen
again.
Timing Window
Summary of Contents for Profiler
Page 1: ......
Page 76: ...Profiler User Guide 4 30...
Page 124: ...Profiler User Guide Appendix 15 6 Click Advanced Options 7 Click Windows Startup Settings...
Page 138: ...Profiler User Guide Appendix 29...
Page 139: ...Profiler User Guide Appendix 30...
Page 140: ...Profiler User Guide Appendix 31...
Page 141: ...Profiler User Guide Appendix 32...
Page 142: ...Profiler User Guide Appendix 33...
Page 144: ...Profiler User Guide Appendix 35...
Page 145: ...Profiler User Guide Appendix 36...
Page 146: ...Profiler User Guide Appendix 37...
Page 147: ...Profiler User Guide Appendix 38...
Page 148: ...Profiler User Guide Appendix 39...
Page 149: ...Profiler User Guide Appendix 40...
Page 150: ...Profiler User Guide Appendix 41...
Page 151: ...Profiler User Guide Appendix 42...
Page 152: ...Profiler User Guide Appendix 43...


