


Managing Oximetry Data
74
Operator’s Manual
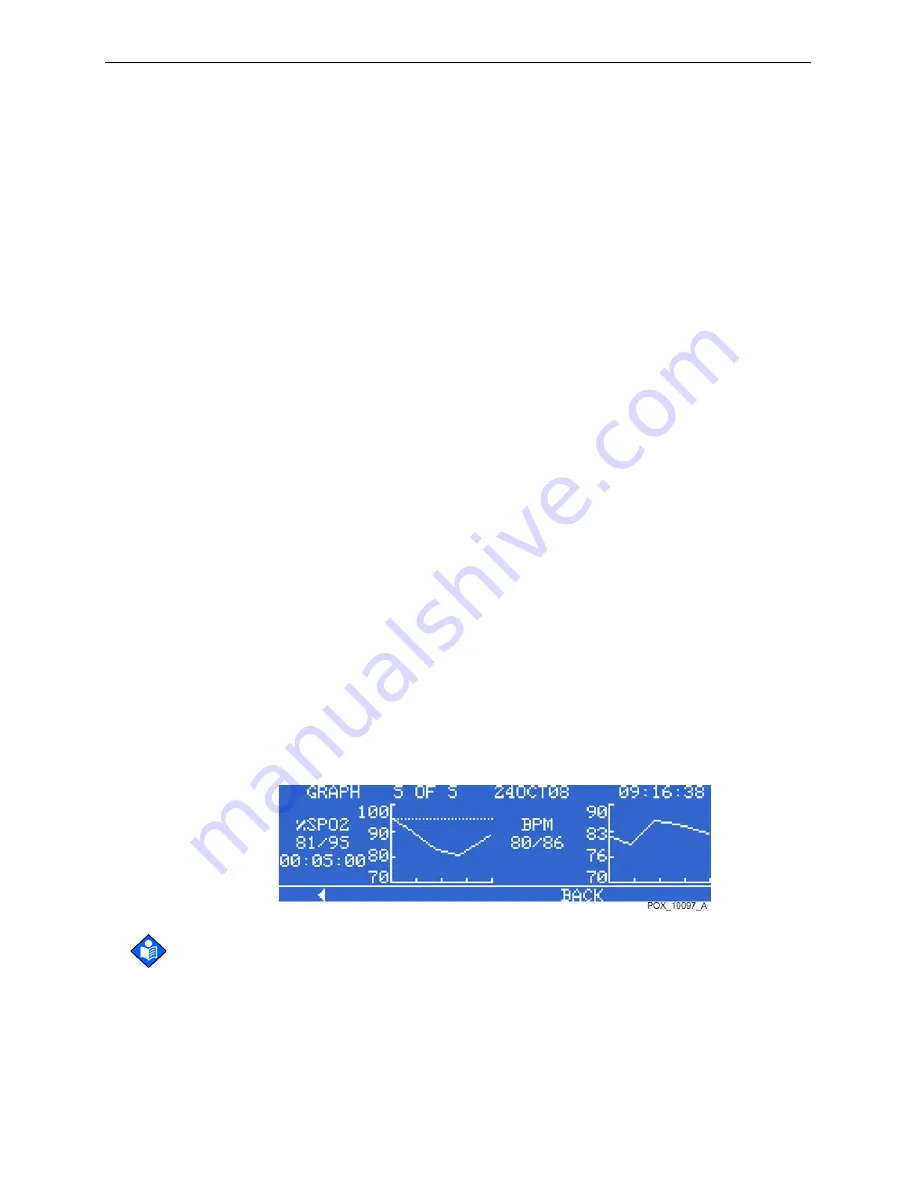
oximetry sensor are shown to the right of the title (example, 2/2). The date and time
of the displayed event are shown in the upper center and upper right corner.
The type of data displayed in the graph is indicated to the left of the vertical axis
(%SpO
2
). Below this is the range of values (min./max.) during the event. The duration
of the event is shown below the range value. The vertical axis of the graph is labeled
to show the magnitude scale of the graphed data. The horizontal axis is not labeled
but automatically scales to accommodate the number of 30-second intervals during
the event. The alarm threshold (lower than SpO
2
alarm limit) is represented by a
horizontal dotted line across the graph. The first data point is the alarm threshold.
Events are displayed one at a time and one per graph. Graphs are displayed in
chronological sequence, with the most recent event shown first when accessing the
graphical sensor event display. The user can move between events by using the two
left-most softkeys which are labeled with left- and right-facing arrow icons,
respectively. At the beginning of an event sequence, event one of two events, the
left arrow softkey is blank; at the end of a sequence, event two of two events, the
right arrow softkey is blank.
The ADJUST UP and ADJUST DOWN keys below the ALARM SILENCE key on the
oximeter panel can also be used to move through events.
The BACK softkey returns to the previous TREND/SENSOR submenu level.
To view Sensor Event History data
With the oximeter in the normal monitoring mode, you can view sensor event
history data.
1. Connect an OxiMax pulse oximetry sensor containing patient data to the oximeter’s SpO
2
sensor port and cable.
2. Press the TREND softkey.
3. Press the SENSOR softkey.
4. Press the GRAPH softkey.
Figure 65.
Sensor Event Graphical History Screen, Page 5
Note:
Use the left and right arrow softkeys to scroll through the pages of the event graph.
5. Press the EXIT softkey.
A sequence of %SpO
2
+ BPM (saturation plus pulse rate) dual-view event graphs
are shown below. The dual-view graph is the same as a single graphical event
Summary of Contents for Nellcor OxiMax N-600x
Page 1: ...Operator s Manual Nellcor N 600x Pulse Oximeter Alarm Management System OximaxTM Technology TM...
Page 10: ...Safety Information 4 Operator s Manual Page Left Intentionally Blank...
Page 21: ...Oximeter Features Operator s Manual 15 Figure 6 Second SpO2 Event No SatSeconds Alarm...
Page 26: ...General Introduction 20 Operator s Manual Page Left Intentionally Blank...
Page 126: ...Theory of Operations 120 Operator s Manual Page Left Intentionally Blank...
Page 145: ......


