


6 Measurement Optimization
6.5 Improvement of Phase Measurement Accuracy
193
Fig. 6.9 Automatic Port Extension
6.5.4 Frequency Point Interval
1) Sample the data of discrete frequency points, connect each sampling point and form a trace on the screen.
2) If the phase deviation of two adjacent frequency points of the device is more than 180°, the displayed phase
slope will look like the reverse phase. This is caused by mixing as a result of insufficient data sampling.
If the group delay is measured but the phase slope is opposite, the symbol will be changed as a result of the group
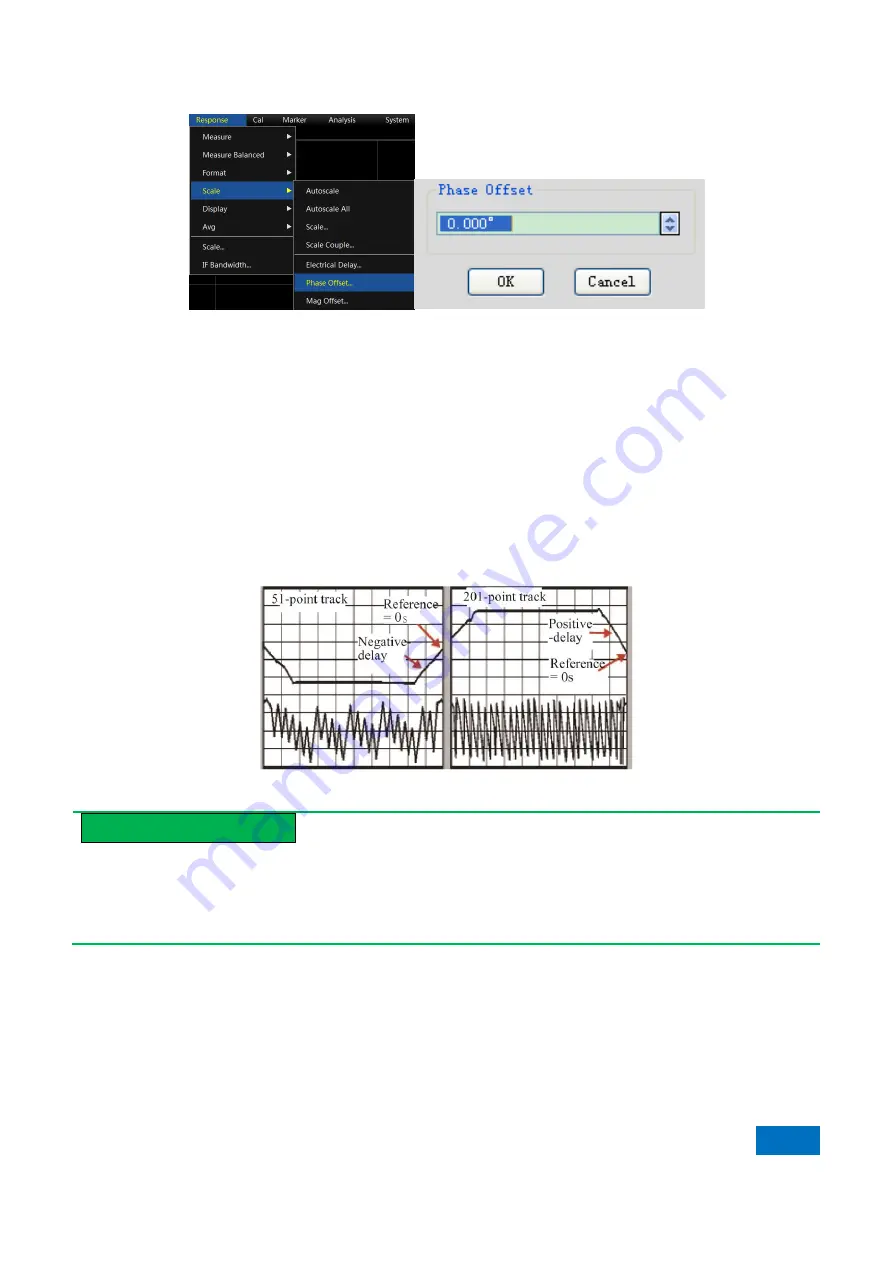
delay. For example, Fig. 6.10 shows the measurement results of the surface acoustic wave (SAW) bandpass filter.
a) The first figure shows the measurement results of 51 points, and the group delay is negative. But this is
impossible in the actual situation, as the response will not be below the reference line (0s).
b) The second figure shows the measurement results of 201 points, and the group delay is positive, that is, the
response is above the reference line (0s).
Fig. 6.10 Influence of Frequency Interval on Phase Measurement
Prompt
Mixing check
In order to check mixing in measurement, you can check whether the display data change by reducing the
frequency interval. You can increase the number of frequency points or reduce the frequency interval to avoid
mixing.
6.5.5 Specific Operations
1) Compensation of linear phase deviation
Menu path:
[Response] > [Scale] > [Electrical Delay...]
.
Enter the required value in the
[Electrical Delay]
box or select the value with the arrow.
Enter the value in the
[Velocity Factor]
box or select the value between 0 and 1.0 with the arrow.
➢
1.0 corresponds to the light velocity in vacuum.
Summary of Contents for AV3672 Series
Page 3: ......
Page 4: ...AV3672 Series Vector Network Analyzer Contents...
Page 5: ......
Page 124: ...5 Menu 5 1 Menu structure 120 5 1 2 Track Fig 5 2 Track Menu...
Page 125: ...5 Menu 5 1 Menu structure 121 5 1 3 Channel Fig 5 3 Channel Menu...
Page 126: ...5 Menu 5 1 Menu structure 122 5 1 4 Excitation Fig 5 4 Excitation Menu I...
Page 127: ...5 Menu 5 1 Menu structure 123 Fig 5 5 Excitation Menu II...
Page 128: ...5 Menu 5 1 Menu structure 124 Fig 5 6 Excitation Menu III...
Page 129: ...5 Menu 5 1 Menu structure 125 5 1 5 Response Fig 5 7 Response Menu I...
Page 130: ...5 Menu 5 1 Menu structure 126 Fig 5 8 Repsonse Menu II...
Page 131: ...5 Menu 5 1 Menu structure 127 Fig 5 9 Response Menu III...
Page 132: ...5 Menu 5 1 Menu structure 128 Fig 5 10 Response Menu V Fig 5 11 Response IV...
Page 133: ...5 Menu 5 1 Menu structure 129 5 1 6 Calibration Fig 5 12 Calibration Menu...
Page 134: ...5 Menu 5 1 Menu structure 130 5 1 7 Marker Fig 5 13 Cursor Menu I...
Page 135: ...5 Menu 5 1 Menu structure 131 Fig 5 13 Cursor Menu II...
Page 136: ...5 Menu 5 1 Menu structure 132 Fig 5 15Marker Menu III...
Page 137: ...5 Menu 5 1 Menu structure 133 5 1 8 Analysis Fig 5 16 Analysis Menu I...
Page 138: ...5 Menu 5 1 Menu structure 134 Fig 5 17 Analysis Menu II...
Page 139: ...5 Menu 5 1 Menu structure 135 Fig 5 18 Analysis Menu III...
Page 140: ...5 Menu 5 1 Menu structure 136 5 1 9 System Fig 5 19 System Menu I...
Page 141: ...5 Menu 5 1 Menu structure 137 Fig 5 20 System Menu I...
Page 254: ...8 Basis of Network Measurement 8 3 Amplifier Parameter Specifications 250...
Page 257: ...8 Basis of Network Measurement 8 4 Complex Impedance 253...
Page 373: ...Appendix Appendix 4 Pulse Measurement 369 Fig 4 9 Receiver gain configuration Dialog Box...


