4 Operation Guide
4.1 Function operation guide
34
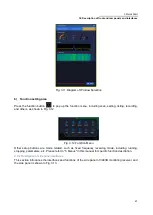
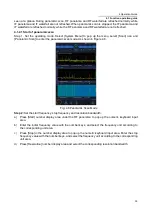
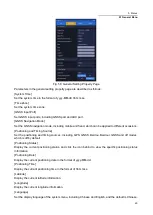
Fig. 4.5 Intermediate Frequency Spectrum
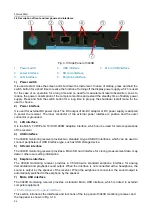
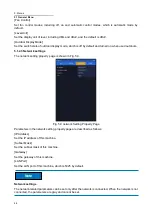
b) Intermediate frequency waterfall plot: the spectrum information within the bandwidth is displayed
through the waterfall plot. The center frequency, bandwidth and resolution bandwidth can be set,
and the parameters are associated with the intermediate frequency spectrum chart. As shown in
Figure 4.6.
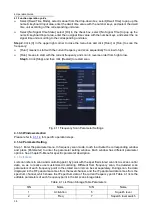
Fig. 4.6 Intermediate Frequency Waterfall Plot
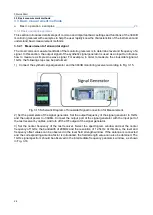
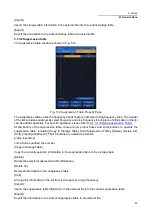
c) Level display diagram: displays the measured value of the current level channel, frequency offset,
field strength (connected antenna) and other information. As shown in Figure 4.7.
Fig. 4.7 Level Display Diagram
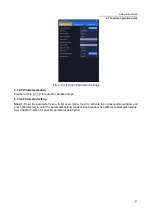
4.1.1.5 Parameter Setting
Step 1: Touch to activate the corresponding window and press [Parameter] to enter the parameter
setting window. Each window has different parameter options. Please refer to
parameter description.
4.1.2 Panoramic scan
Traditional spectrum analysis can perform many measurement functions, which is usually enough for
laboratory users. However, the execution of field tasks needs to search for signals quickly, and it is also
hoped that signals can be observed from different angles or maps. Therefore, this software provides
panoramic scan analysis function that can search signals quickly.
Panoramic scan refers to scanning the whole radio frequency to find the signal quickly, and only the
spectrum analysis channel is analyzed during the panoramic scan. Panoramic scan can sweep the
selected frequency range according to the selectable resolution bandwidth, connecting up to 20MHz
intermediate frequency windows, thus covering the whole predefined scan range. Every window is
calculated by FFT. Panoramic scan can sweep the spectrum quickly in a wide frequency range, so that
users can find the signal quickly.
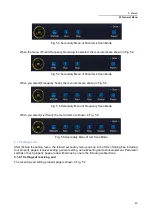
Users can customize the selection window, and choose any 2-3 windows from the four windows of IF
panorama, IF waterfall, RF panorama and RF waterfall for observation, so that the signal details can be


