


Chapter 8: Geometry Application
157
• Display a submenu for drawing a figure of specially shaped
figures such as triangles and rectangles (page 162) ............................................ Draw - Special Polygon
• Display a submenu for drawing functions (page 160) ............................................................ Draw - Function
• Insert a value or text connected with a displayed figure into
the display (pages 161 through 162) .............. Draw - Text / Attached Angle / Measurement / Expression
• Display a slider (page 172) for the currently selected object. ..................................................... Draw - Slider
• Display a submenu for geometric constructions (page 163) ................................................. Draw - Construct
• Activate Toggle Select (page 167) .....................................................................Tap
i
and then tap a figure
Tip:
The View menu Zoom Box (
Q
), Zoom In (
W
), and Zoom Out (
E
) commands are the same as the Graph &
Table application Box, Zoom In, and Zoom Out commands on the Zoom menu. For more information about these
commands, see “Chapter 3: Graph & Table Application”.
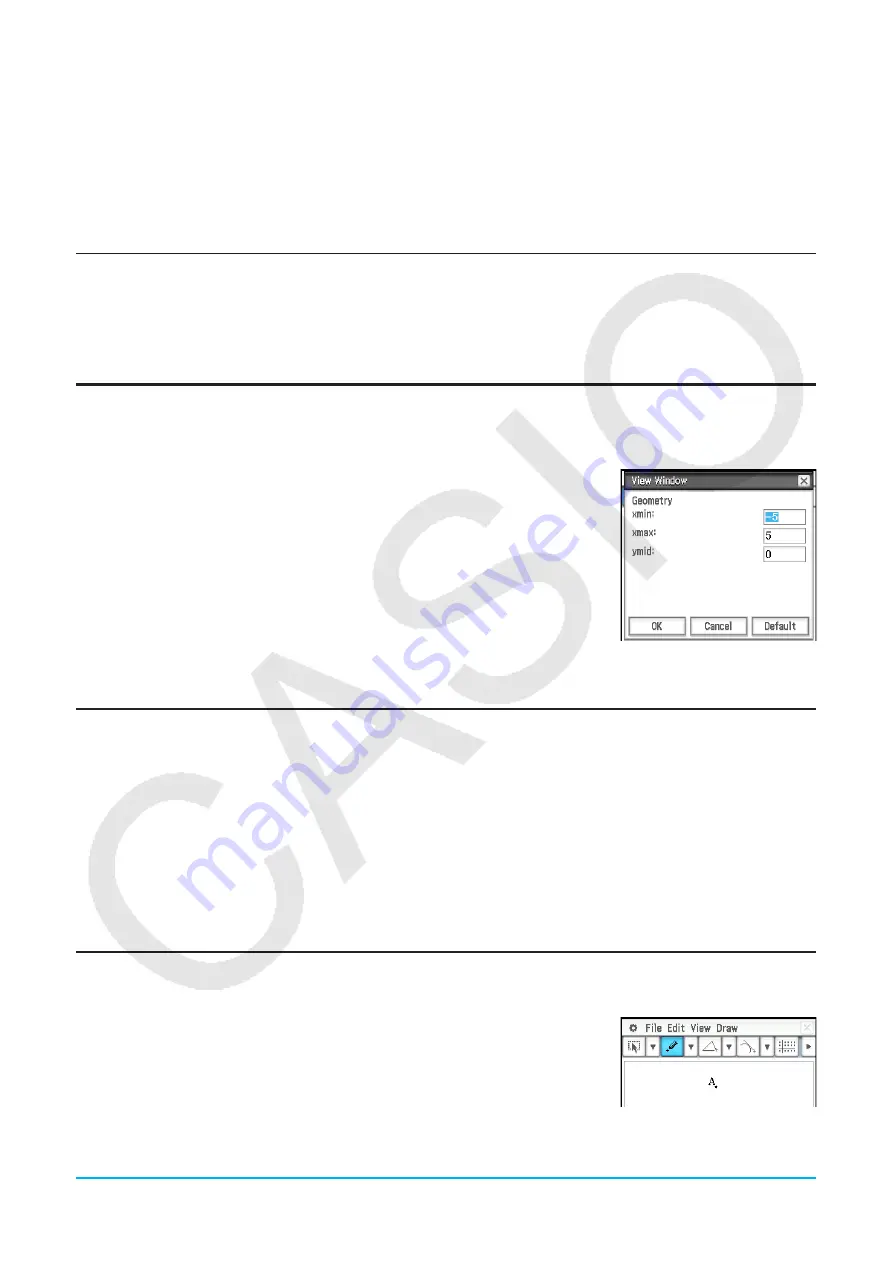
Configuring Geometry View Window Settings
You can use the following procedures to configure settings that control the appearance of the Geometry
application window.
Tap
O
, and then [View Window] to display the View Window dialog box. The
View Window dialog box allows you to configure the
x
-axis range of values.
The
y
mid value is used to center the Geometry window vertically. For example,
if we set
y
mid = 2, the
y
-axis will appear 2 units below the center of the
Geometry window.
The following are the allowable ranges for the indicated View Window
parameters.
−1 × 10
6
s
x
min
s
1 × 10
6
−1 × 10
6
s
y
mid
s
1 × 10
6
−1 × 10
6
s
x
max
s
1 × 10
6
x
max −
x
min
t
1 × 10
−4
About the Geometry Format Dialog Box
Settings for the Geometry application can be configured on the Geometry Format dialog box which appears
when you tap
O
and then [Geometry Format]. See “1-7 Configuring Application Format Settings” for more
information.
8-1
Drawing Figures
This section explains how to use the Geometry application to draw various types of figures. It also explains how
to use the geometric construction tools to investigate theorems and properties in Geometry.
Drawing a Figure
u
To plot a point
1. Tap [Draw] - [Basic Object] - [Point], or tap
[
.
2. Tap the location on the screen where you want to plot a point.


