20050501
3-4 Using Table & Graph
The Graph & Table application includes a “Table window” for displaying number tables and
summary tables generated with the functions you input on the Graph Editor window.
Generating a Number Table
You can use either of the following two methods to generate a number table using a Graph &
Table application function. The method used to generate the number table depends on the
setting of the Basic Format dialog box [Table Variable] item.
• For details about Basic Format settings, see “14-3 Setup Menu Settings”.
u
Specifying a range of values for
x
using the Table Input dialog box
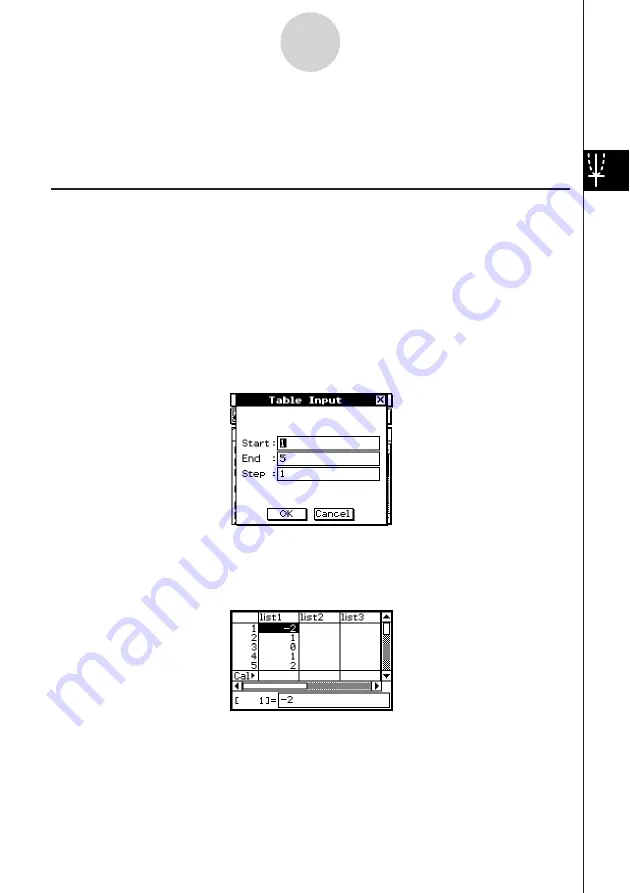
This is the initial default number table generation method. With this method, you use the
Table Input dialog box to specify a range of values for variable
x
, and then generate a
number table for those values. This number table generation method is in effect whenever
“Table Input” is selected for the [Table Variable] setting.
3-4-1
Using Table & Graph
u
Assigning list values to
x
With this number table generation method, you must first use the List Editor to create a list
and store the list data. To access the List Editor, tap
O
and then [List Editor].
For details about using the List Editor, see Chapter 7.
Summary of Contents for ClassPad 300 PLUS
Page 11: ...20050501 ClassPad 300 PLUS ClassPad OS Version 2 20 ...
Page 197: ...20050501 2 10 7 Using Verify 4 Input x 2 1 and press E 5 Input x i x i and press E ...
Page 649: ...20050501 u Graph Line Clustered D u Graph Line Stacked F 13 8 2 Graphing ...
Page 650: ...20050501 u Graph Line 100 Stacked G u Graph Column Clustered H 13 8 3 Graphing ...
Page 651: ...20050501 u Graph Column Stacked J u Graph Column 100 Stacked K 13 8 4 Graphing ...
Page 652: ...20050501 u Graph Bar Clustered L u Graph Bar Stacked 13 8 5 Graphing ...


