


Open Path Eddy Covariance System
18
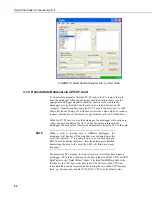
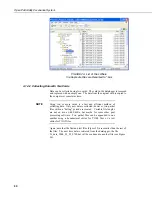
3.4.2 Status Table
The “Status” table contains useful information about the performance and
status of the system (see Appendix A in the datalogger manual). To view the
“Status” table with LoggerNet, go to the Connect Screen and select the
Tools|Status Table … menu (see Section 5.1.10 in the LoggerNet manual).
With the keyboard display, follow this menu path System Menu|Status. Useful
information in the “Status” table includes, but is not limited to:
OSVersion:
Version and revision of the CRBasic datalogger operating
system. As of the printing of this document, Campbell Scientific, Inc.
recommends using, CR3000 OS v3.0, CR1000 OS v10.0, or CR5000 OS v2.1
or greater.
WatchdogErrors:
Number of times the watch dog timer reset the datalogger.
Normally, this count should be 0.
CompileResults:
Reports compile errors.
VarOutOfBound:
An element of an array was referenced that does not exist,
e.g. a VarOutOfBound is reported if element wind(9) is referenced in the
program, but the array was defined with 5 elements.
SkippedScan:
If the maximum number of buffered scans is exceeded (defined
in the third parameter of the Scan () instruction), the Processing and
Measurement tasks are resynchronized. The resynchronization results in a
number of SkippedScan equal to the buffer depth.
DataFillDays():
The number of days to fill a table in both the CPU and CRD
memory. The number of days to fill a table is reported in the same order they
are found in the “Status” table, e.g. the same order they are defined in the
program.
CardStatus:
Indicates if a card is used by the program or not.
ProcessTime:
Time, in microseconds, it takes the datalogger to complete all
the processing. In the Sequential mode, this value must always be less than the
Scan Interval. In the PipeLine mode, this value can occasionally be greater
than the Scan Interval, e.g. when the 30 minute fluxes are computed. With the
eddy covariance systems, always use the Pipeline mode.
BuffDepth:
The current number of Scans that the datalogger Processing tasks
have fallen behind the Measurement tasks. In the Pipeline Mode, the
datalogger processing task can periodically fall behind the Scan Interval.
MaxBuffDepth:
The maximum number of Scans that the Processing tasks
have fallen behind the Measurement tasks.
4. Data
Each system requires an eddy covariance program (p/n 18442 or 18443). The
data table outputs of the programs are described in a Microsoft
®
Excel
document (shipped with the program). The description includes the variable
name and units. There is one sheet (tab) per output.