


CR10X Reference Manual
10-10
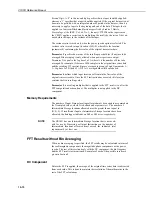
The equivalent RC time constant is given by T/W, where T is the sampling time in
seconds. For values of W less than 0.25, the analogous ‘cut-off’ frequency (the
frequency where the ratio of output to input is .707) is accurately represented by
W/(2
π
T). For larger values of W, this ‘analogue’ estimate of the cut-off frequency
becomes less representative.
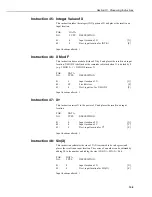
On the first execution after compiling, F(X) is set equal to X.
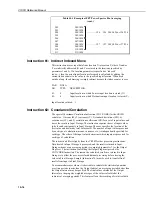
PAR.
DATA
NO.
TYPE
DESCRIPTION
01:
2
Repetitions
[REPS]
02:
4
First input location for input data
[X]
03:
4
Destination input location for first filtered
result
[F(X) or Z]
04:
FP
Weighting function, W
[W]
Input locations altered: 1 per repetition
Input locations required: 1 per repetition
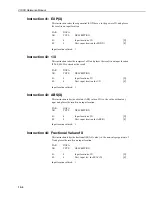
Instruction 59: Bridge Transform
This instruction is used to aid in the conversion of a ratiometric bridge
measurement by obtaining the value for R
s
which is equivalent to R
f
[X/(1-X)],
where X is the value derived by the standard CR10X bridge measurement
instructions (with appropriate multiplier and offset; see Section 13) and
R
f
represents the multiplier value. The result of Instruction 59 is stored in the
same location that X was.
PAR.
DATA
NO.
TYPE
DESCRIPTION
01:
2
Repetitions
[REPS]
02:
4
Starting input location and destination
[X]
03:
FP
Multiplier (R
f
)
[MULT.]
Input locations altered:
1 per repetition
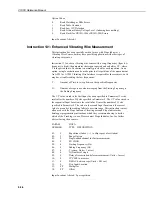
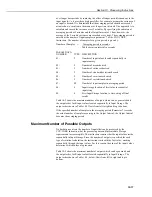
Instruction 60: Fast Fourier Transform
Instruction 60 performs a Fast Fourier Transform (FFT) on a set of data contained
in contiguous locations in Input Storage. The FFT is used to obtain information on
the relative magnitudes and phases of the various frequency components in a time
varying signal.
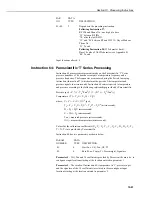
FFT theory requires that the signal be sampled at a frequency that is at least two
times faster than the highest frequency component in the signal. For example, a
signal representing ocean waves with a maximum frequency of 0.125Hz would
need to be sampled at a rate of 0.25Hz or greater. The measurements must be
made at the appropriate sampling rate and stored in contiguous input locations
before the FFT can be applied. The measured data stored in sequential input lo-
cations is also referred to as the ‘original time series data’.
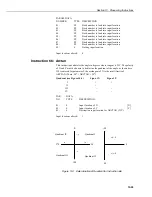
The results of the FFT can be expressed as: 1) the real and imaginary components,
2) the magnitude and phase components, or 3) the power spectra. The real and
imaginary results are analogous to the orthogonal (east and north) representation
of a wind vector. The magnitude and phase results are analogous to the polar