


CMP3 Pyranometer
11
source for programming code to start a new program or add to an existing
custom program.
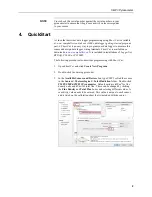
Short Cut
cannot edit programs after they are imported and edited
in
CRBasic Editor
.
A
Short Cut
tutorial is available in Section
. If you wish to
import
Short Cut
code into
CRBasic Editor
to create or add to a customized
program, follow the procedure in Appendix
(p. A-1)
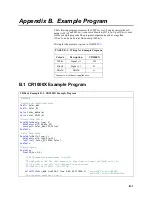
. Programming basics for CRBasic data loggers are
provided below. A complete program example can be found in Appendix
(p. B-1)
.
Solar radiation can be reported as an average flux density (W/m
2
) or daily total
flux density (MJ/m
2
). The appropriate multipliers are listed in TABLE
. The
example reports both average and daily total solar radiation.
The CMP3 outputs a low level voltage ranging from 0 to a maximum of up to
20 mV, in natural light, depending on the calibration factor and radiation level.
A differential voltage measurement has better noise rejection than a single-
ended measurement. Use a single-ended measurement if a differential terminal
is not available. To determine the acceptability of a single-ended measurement,
compare the results of single-ended and differential measurements made under
the same conditions.
Possible sources of electrical noise include power lines, electric pumps, or
motors. If the sensor or data logger is located in an electrically noisy
environment, the measurement should be made with the 60 or 50 Hz rejection
integration option as shown in Appendix
.
7.4.1 Input Range
The output voltage is usually between 5 and 20 mV per 1000 W
/
m
2
. When
estimating the maximum likely value of sensor output a maximum value of
solar radiation of 1100 W
/
m
2
can be used for field measurements on a
horizontal surface. Plane of array irradiances can exceed 1500 W
•
m
–2
.
Select the input range as follows:
1. Estimate the maximum expected input voltage by multiplying the
maximum expected irradiance (in W/m
2)
by the calibration factor
(µV / W
•
m
–2
). Divide the answer by 1000 to give the maximum in
millivolt units.
2. Select the smallest input range that is greater than the maximum expected
input voltage. The exact range will depend on the sensitivity of your
individual sensor and the maximum expected reading. With some data
loggers an autorange option can be used if measurement time is not
critical.
The slow or 60 Hz rejection integration gives a more noise-free reading. A fast
integration takes less power and allows for faster throughput.
NOTE