Power Graph
45
Item
Description
•
Green icon indicates ultrasound is ready to start or currently
running.
•
Yellow icon indicates further steps are required to start the
ultrasound.
•
Red icon indicates there is an error detected and ultrasound
is not running.
•
Black icon indicates the channel is not active.
Percentage of the maximum average power currently being
delivered.
Note: 0% indicates ultrasound is NOT currently being delivered.
Channel A power is plotted with a solid line.
Channel B power is plotted with a dashed line.
Example Power Graphs
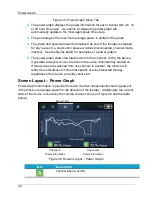
The power graph screen (Figure 37) shows an example of what is displayed for two
devices using two channels. One device is connected to channel A and one device is
connected to channel B. Ultrasound therapy has been running for approximately 13.5
hours continuously for both devices and is currently on as indicated by the green
channel icons and the 63% and 67% power levels. The average power for channel A
has stayed between 50% to 65% during the runtime. This is indicated by the solid white
line. The average power for channel B has been slightly higher between 55% to 75%.
This is indicated by the dashed white line.
Figure 37. Example - Two Channel Power Graph
Summary of Contents for EKOS
Page 65: ...Symbols and Indicators 61 ...


