


KAPTOR
MINI
–
User Manual
–
V0.1 - pg.35
11.4.2
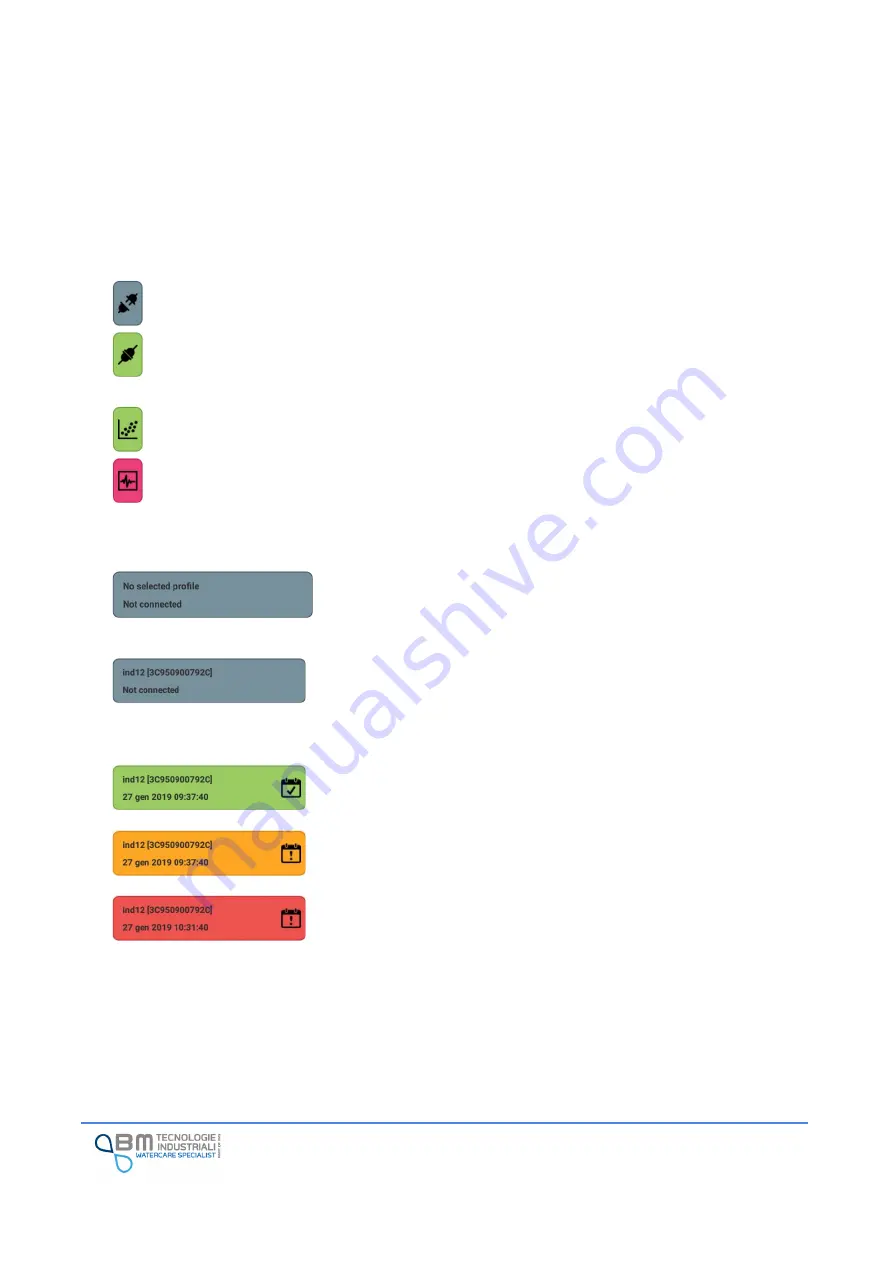
Status bar
The status bar, at the top, provides indications regarding the status of the instrument and allows the user
a quick access to some of the functions.
The block on the right indicates the connection status with the instrument and allows the user to start the
connection and disconnection procedure:
Disconnected
Connected
The central block indicates the working mode of the instrument and allows the user to change it:
Discontinuous working mode (low power).
Continuous working mode. The red color means it is a high consumption working mode. It is
preferable not to select this working if the user has no other power supply sources than the
battery.
Icons could have a grey color if the App is off-line.
The block on the left shows different types of information based on the App's operating mode:
By opening the App, in
“
off-line
”
mode, the bar is gray and with the
words
“
No profile selected
”
and
“
Not connected
”
.
In this situation it is possible to connect to an instrument or select a
profile to check and/or modify (see dedicated paragraphs below).
By selecting a profile, the block does not change color and the wording
“
Not connected
”
remains, but the name of the instrument (if set) and
its identification will appear in the first row.
In the example shown in the figure,
KAPTOR
MINI
has the name
“
ind12
”
and unique identifier
“
3C950900792C
”.
By connecting, in addition to the instrument name (if set) and its
identification, the second line will indicate the date and time set on the
KAPTOR
MINI
to which you have connected.
In addition, the color of the block and the associated icon will highlight
the status:
✓
Green: normal situation
✓
Orange: there are warnings to consider (profile not loaded on
the instrument, modem profile to be set, ...)
✓
Red: serious errors (open case, not recognized by the tablet...)
By clicking on the icon, you can view and resolve any problems detected
and access information on the instrument including the name
(editable), the hardware and firmware version. Since the App describes
the error and guides the user to find a solution, the complete list of
errors is not available.