


Page 64
724-746-5500 | blackbox.com
Chapter 2: Overview
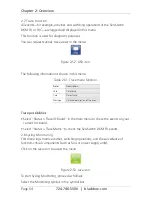
2.7 Trace Function
All events—for example, activities and switching operations of the ServSwitch
DKM FX or FXC—are logged and displayed in this menu.
This function is used for diagnostic purposes.
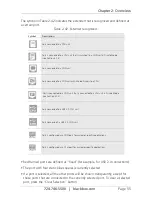
You can request various trace views in the menu:
Figure 2-52. OSD icon.
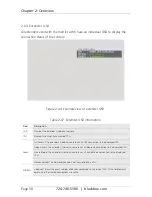
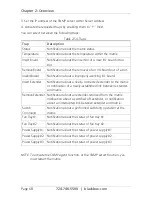
The following information is shown in this menu:
Table 2-51. Trace menu function.
Field
Description
Date
Datestamp
Time
Timestamp
Message
Detailed description of the event
Trace possibilities
• Select “Status > Trace IO Board” in the main menu to check the events on your
current I/O board.
• Select “Status > Trace Matrix” to check the ServSwitch DKM FX events.
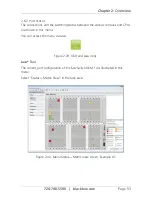
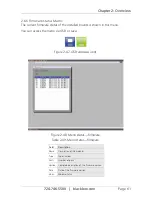
2.8 Syslog Monitoring
This menu logs matrix activities, switching operations, and the surveillance of
function-critical components (such as fans or power supply units).
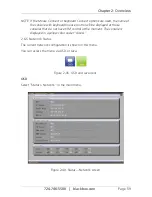
Click on the Java icon to access the menu:
Figure 2-53. Java icon.
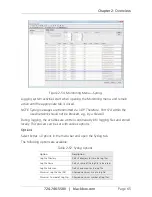
To start Syslog Monitoring, proceed as follows:
Select the Monitoring symbol in the symbol bar.