background image

Cursors


129 


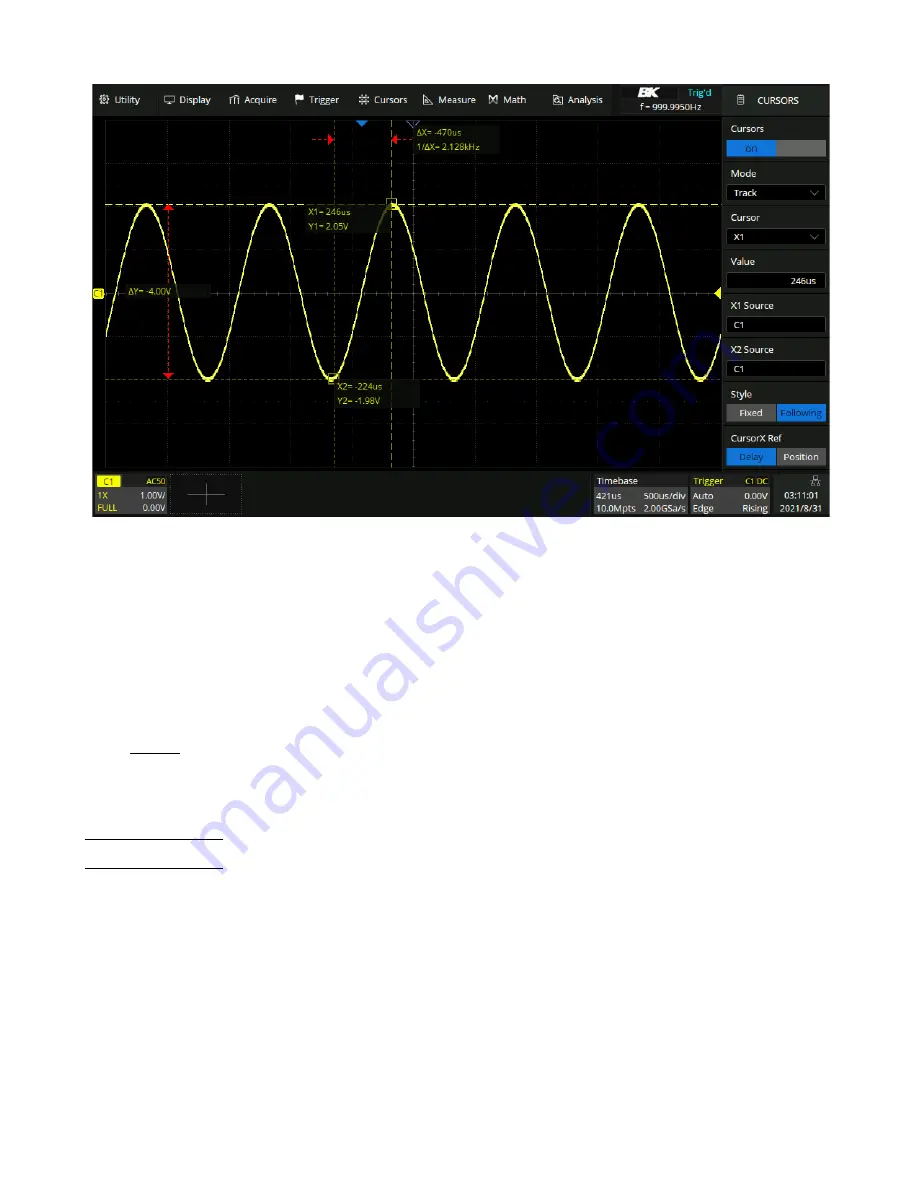
Figure 11.2 

Track Cursor Mode 


Measure

: When measurements are displayed, this mode shows the cursor locations used to make the measurement. 

When you add a measurement, it becomes the one that cursors are displayed for. The measurement whose cursor 
locations are displayed is selected in the 

Measure Item 

option. Figur

11.3 

demonstrates measure mode with 

cursors measuring width. 


11.1


X Cursors


X cursors are vertical dashed lines that adjust horizontally and can be used to measure time (when the source is FFT 
waveform, X cursors measure frequency). 


X1 cursor is the left (default position) vertical dotted line; it can be moved to any place of the screen. 

X2 cursor is the right (default position) vertical dotted line; it can be moved to any place of the screen. 

Use the 

Universal Knob 

to set the X1 and X2 cursor values. The values are displayed in the cursors box along with the 

difference between X1 and X2 (T) and 1/T. (See figure 

11.4

) 


When cursor type is set to X2-X1, use 

Universal Knob 

to move the X1 and X2 cursors together. The value under the 

menu option is the difference between the X1 and X2 cursors. 

Summary of Contents for 2560B Series

Page 1: ......

Page 2: ...so accompanied by a maximum voltage of the circuit to be tested which defines the voltage impulses expected and required insulation clearances These categories are Category I CAT I Measurement instrum...

Page 3: ...r flammable atmosphere Do not operate the instrument in the presence of flammable gases or vapors fumes or finely divided particulates The instrument is designed to be used in office type indoor envir...

Page 4: ...when the covers are removed To avoid injuries always disconnect the power cord from the instrument disconnect all other connections for example test leads computer interface cables etc discharge all c...

Page 5: ...This instrument is intended for indoor use and should be operated in a clean dry environment Temperature Operating 0 to 40 Non operation 20 to 60 Direct sunlight radiators and other heat sources shou...

Page 6: ...collection facilities in the disposition of this product and otherwise observe all applicable requirements Safety Symbols Symbol Description indicates a hazardous situation which if not avoided will...

Page 7: ...5 Check Model and Firmware Version 21 2 3 6 Function Check 22 2 4 Probe Safety 23 3 Control Panel 25 3 1 Vertical Control 25 3 2 Horizontal Control 26 3 3 Trigger Control 26 3 4 Run Stop Key 27 3 5 Au...

Page 8: ...gital Channels 50 8 7 Displaying Digital Channels as a Bus 50 9 Trigger 52 9 1 Trigger Source 53 9 2 Trigger Types 54 9 2 1 Edge Trigger 54 9 2 2 Slope Trigger 55 9 2 3 Pulse Trigger 57 9 2 4 Video Tr...

Page 9: ...r 111 10 8 3 I2S Serial Decode 112 10 9 MIL STD 1553B Trigger and Serial Decode 113 10 9 1 MIL STD 1553B Signal Configuration 113 10 9 2 MIL STD 1553B Serial Decode 114 10 10 SENT Trigger and Serial D...

Page 10: ...rs Tool 164 13 5 3 Measure the FFT Waveform 165 13 6 Formula Editor 166 14 Reference Waveform 167 14 1 Save REF Waveform to Internal Memory 167 14 2 Display REF Waveforms 167 15 Search 169 16 Navigate...

Page 11: ...197 19 10 1 PSRR Configuration 197 19 10 2 PSRR Amplitude 197 19 11 Power Efficiency 198 19 11 1 Power Efficiency Input Setup 198 20 Bode Plot 199 20 1 Bode Plot Configuration 200 20 1 1 Connection 20...

Page 12: ...23 8 Start Self Cal 218 23 9 Power On Line 218 24 Remote Control 219 24 1 Web Browser 219 24 2 Other Connectivity 220 25 Troubleshooting 221 26 Service Information 223 27 LIMITED THREE YEAR WARRANTY 2...

Page 13: ...s for a wide range of applications With increasing bandwidths to 350 MHz in a 4 channel configuration each model offers a maximum sample rate of 2 GSa s and a maximum memory depth of 200 Mpts Equipped...

Page 14: ...ers with trigger zone support 50 MHz DDS waveform generator supports Bode plots Power analysis includes 11 analyzing tools Automatic measurements with statistics and histogram Math function supports 2...

Page 15: ...565B MSO 2567B 2567B MSO 2569B 2569B MSO Probe PR150B PR250B PR500B Bandwidth 150 MHz 250 MHz 500 MHz Attenuation Value X1 X10 X10 X10 Table 1 1 Probes 1 x LP2560 MSO models Ensure the presence of all...

Page 16: ...ol Panel Includes control knobs and keys See section Control Panel 3 WaveGen Built in waveform generator output 4 Probe Compensation Supplies a 0 3 3 V 1 kHz square wave for compensating the probes 5...

Page 17: ...a source in several of the trig 3 USB Interface Connect a USB type B to type A to remotely control the unit 4 LAN Connect an ethernet cable to remotely control the unit over the network lock the instr...

Page 18: ...splays the available options in the selected menu Trigger Delay Indicator Displays the trigger status 3 Trigger Status Displays the trigger status USB Host Port Indicator Indicates that a USB is conne...

Page 19: ...fy that the AC power cord including the extension line is compatible with the rated voltage current and that there is sufficient circuit capacity for the power supply Once verified connect the cable f...

Page 20: ...nnected to the instrument before proceeding Check and or Change Fuse Locate the fuse box next to the AC input connector in the rear panel See figure 1 4 Insert a small flathead screwdriver into the fu...

Page 21: ...ument has 3 self test option to test the screen keyboard and the LED back light To perform the self test please refer to the Self Test section for further instructions 2 3 4 Self Cal Self option runs...

Page 22: ...the switch to 1X on the probe and connect the probe to channel 1 To do this align the slot in the probe connector with the key on the CH1 BNC push to connect and twist to the right to lock the probe i...

Page 23: ...he ground terminal to the ground before you take any measurements To avoid electric shock when using the probe keep fingers behind the guard on the probe body To avoid electric shock while using the p...

Page 24: ...easurements using a probe verify the compensation of the probe and adjust it to match the channel inputs To match your probe to the input channel 1 Set the channel s probe attenuation to 10X Press the...

Page 25: ...e is one channel on off key for each analog channel Digital Key Enable disable the digitals channels and display the waveforms See section Digital Channels for more details Math Key The Math key provi...

Page 26: ...he knob clockwise or after the trigger turn the knob counterclockwise can be seen Panning through the waveform when the oscilloscope is stopped not in Run mode will display the waveform data from the...

Page 27: ...the Run Stop key is red data acquisition is stopped To start acquiring data press the Run Stop key To capture and display a single acquisition whether the oscilloscope is running or stopped press the...

Page 28: ...ence and Resolution can be set See section Acquire for more details Display Access the Display menu to enable persistence adjust the display grid graticule intensity label waveforms add an annotation...

Page 29: ...es bmp jpg png Enables Disables the touch screen The LED on the button lights to indicate that the touch screen is working Enables disable the cursors Cursors are used to make custom measurements See...

Page 30: ...tion the simplest way of interpolation connects two original points with a straight line Sinc Sin x x interpolation the original point is interpolated according to the Nyquist reconstruction formula w...

Page 31: ...tual sample points are related to the current timebase and may be less than memory depth The actual sample points information can be obtained in the timebase descriptor box see the section Timebase an...

Page 32: ...can achieve a minimum 2 s trigger interval in sequence mode corresponding to a waveform update rate of 500 000 wfms s Sequence mode can capture and record rare events over long time periods The oscil...

Page 33: ...History button on the front panel to enable the History function The history menu shown in figure 5 1 will be displayed 2 Touch History to toggle the history function on and off 3 Touch Frame No and...

Page 34: ...acquisitions 6 1 Adjusting the Horizontal Scale time div To adjust the horizontal scale Use the touchscreen horizontal pinch gesture Use the touchscreen controls to open the Main Timebase dialog by pr...

Page 35: ...touchscreen controls to open the Main Timebase dialog by pressing the timebase descriptor box Figure 6 4 Timebase Descriptor Box Press the Delay box to set the horizontal scale by the virtual keypad...

Page 36: ...rizontal Position Knob has a different purpose in the Zoom display See section Zoom for more details 6 3 Panning and Zooming Single or Stopped Acquisitions When the oscilloscope is stopped use the tou...

Page 37: ...lysis of the waveform To enable the Zoom function Press the Zoom key or push the Horizontal Scale Knob Zoom can also be enabled using the touch screen Press the Acquire option located on the Menu Bar...

Page 38: ...on the Menu Bar Then press Roll In Roll mode there is no trigger The fixed reference point on the screen is the right edge of the screen and refers to the current moment in time Events that have occu...

Page 39: ...urn on the corresponding channel Its channel descriptor box and Channel menu will appear on the display Push the same button againto disable the channel The channel menu also has an on off option 7 1...

Page 40: ...vertical scale When Fine adjustment is selected you can change the channel s vertical sensitivity in smaller increments The channel sensitivity remains fully calibrated when Fine is on When Fine is tu...

Page 41: ...of the signal by simply noting its distance from the ground Alternating Current The signal is capacitively coupled DC signal components are rejected See the datasheet for details of the cut off frequ...

Page 42: ...ncy noise from the waveform To set the bandwidth limit 1 Press the desired channel key 2 In the Channel Menu use the touchscreen to press the BW Limit option A drop down menu will appear with three ba...

Page 43: ...assign the label to the specified source Enable disable the label using the Display option Set the text of the label in the Label Text option Figure 7 6 Label Submenu Label On Label Off Figure 7 7 La...

Page 44: ...nel Menu use the touchscreen to select either V or A Use Volts for a voltage probe Use Amps for a current probe 7 4 8 Deskew When measuring time intervals in the nanoseconds ns range small differences...

Page 45: ...This is a mathematical inversion and does not physically change the actual potential of the input signal Invert Of Invert On Figure 7 8 Invert 7 4 10 Trace When Visible is selected the waveform is di...

Page 46: ...s the integrity of your signal The probe is included with MSO models Figure 8 1 LP2560 Probe To avoid personal injury or damage to the logic probe and any associated equipment the following safety pre...

Page 47: ...el pins connect a grabber to the flying lead probe and then connect the grabber to the node in the circuit to be tested 5 Repeat step 4 until all points of interest are connected Figure 8 2 Connecting...

Page 48: ...nnels 1 Use the touchscreen controls to open the Digital dialog by pressing the digital descriptor box Figure 8 4 Digital Channel Descriptor Box 2 Press the Position box to set the vertical position u...

Page 49: ...gure 8 6 Channel Setting 3 Check or uncheck the box to the left of the channel to be turned on or off D0 D7 and D8 D15 can be checked or unchecked to turn multiple on or off at once Channel s labels c...

Page 50: ...to Custom use the touchscreen to select Threshold Figure 8 8 Logic Setting for the channel group then use the virtual keypad to set the logic threshold Logic Family Threshold Voltage TTL 1 5 V CMOS 1...

Page 51: ...Digital Channels 51 Figure 8 9 Digital Bus...

Page 52: ...oscilloscope fills the pre trigger buffer first and then continuously updates it in FIFO mode until the trigger event arrives After the trigger event the data fills the post trigger buffer When the p...

Page 53: ...you d want to trigger on the 60 Hz AC line for a stable signal The trigger sources supported by each trigger type are different Reference table for more details Table 9 1 Trigger Source Once a trigger...

Page 54: ...Menu to enter the Trigger menu 2 Use the touchscreen controls to select Type The Trigger Type window shown in figure 9 3 will appear Use the touchscreen controls to select a trigger type 9 2 1 Edge Tr...

Page 55: ...nsition from one level to another level in greater than or less than a certain amount of time In the oscilloscope positive slope time is defined as the time difference between the two crossing points...

Page 56: ...of time and lower than the specified upper limit of time value Figure 9 7 Limit Range outside a range of time value Trigger when the positive or negative slope time of the input signal is greater than...

Page 57: ...en the positive or negative pulse time of the input signal is lower than the specified time value For example for a positive pulse if you set t pulse real width 100ns the waveform will trigger Figure...

Page 58: ...width is greater than the upper limit or lower than the lower limit This is the logical complement of the previous triggering interval Figure 9 13 Pulse Trigger Example Holdoff coupling and noise reje...

Page 59: ...deo standard 9 2 Standard Type Sync Pulse NTSC Interlaced BI level PAL Interlaced BI level HDTV 720P 50 Progressive Tri level HDTV 720P 60 Progressive Tri level HDTV 1080P 50 Progressive Tri level HDT...

Page 60: ...ey Turn the Universal Knob to set the value Table 9 5 list the line numbers per field for each video standard Standard Field 1 Filed 2 NTSC 1 to 263 1 to 262 PAL 1 to 313 1 to 312 HDTV 720P 50 HDTV 72...

Page 61: ...d and select the Custom 5 Touch the Custom Setting to open the custom setting menu touch the Interlace to select the required interlace ratio assuming that the interlace ratio is 8 1 Then set the fram...

Page 62: ...d to set the window center and the Delta value is adjusted to set the window range The lower and the upper trigger levels always move together Figure 9 15 Window Trigger If the lower and the upper tri...

Page 63: ...nd Level Cen ter The above two parameters can be set in the following two ways 1 Select the parameter in the Level Delta area of the quick menu then set the parameter value by the virtual keypad or th...

Page 64: ...he touchscreen to select the Limit Range less than a time value Triggers when the positive or negative pulse time of the input signal is lower than the specified time value greater than a time value T...

Page 65: ...uchscreen controls to enter the Trigger Menu 2 Use the touchscreen to select Type 3 The window shown in figure 9 3 will appear Use the touchscreen to select Dropout 4 Use the touchscreen to set the Ov...

Page 66: ...s to enter the Trigger Menu 2 Use the touchscreen to select Type 3 The window shown in figure 9 3 will appear Use the touchscreen to select Dropout 4 Use the touchscreen to set the Over Time Type to S...

Page 67: ...etween Positive and Negative 5 Use the touchscreen to select the Limit Range less than a time value Trigger when the positive or negative slope time of the input signal is lower than the specified tim...

Page 68: ...patterns logical AND OR NAND and NOR combination of the channels Each channel can set to low high or invalid Figure 9 21 Pattern Trigger To select Pattern Trigger type 1 Press the Setup key or use th...

Page 69: ...ttern to don t care on the selected channel Any channel set to don t care is ignored and is not used as part of the pattern If all channels in the pattern are set to Don t care the oscilloscope will n...

Page 70: ...ns are not found the triggers are forced and acquisitions are made so that signal activity is displayed on the oscilloscope Auto trigger mode is appropriate when Checking DC signals or signals with un...

Page 71: ...log by pressing the trigger descriptor box Figure 9 24 Trigger Descriptor Box Press the Level box to set the trigger level by the virtual keypad Figure Press to increase and to decrease the trigger le...

Page 72: ...f trigger coupling modes DC Allows both AC and DC components of the waveform into the trigger path AC Blocks all the DC components and attenuate signals lower than 8 Hz Use AC coupling to get a stable...

Page 73: ...Use the holdoff to trigger on repetitive waveforms that have multiple edges or other events between waveform repetitions You can also use holdoff to trigger on the first edge of a burst when you know...

Page 74: ...of the oscilloscope is adjustable from 8 ns to 30 s 5 Use the virtual keypad or the Universal knob to adjust the number of hold off events or the holdoff time Adjusting the time scale and horizontal...

Page 75: ...to trigger the oscilloscope when Noise Rejection is enabled To enable Noise Rejection To set the start holdoff on 1 Press the Setup key or use the touchscreen controls to enter the Trigger menu 2 Use...

Page 76: ...u 2 Use the touchscreen to select Zone 3 The menu shown in figure 9 32 will appear 4 Press the Zone option to toggle the zone function on or off 9 8 1 Creating and Moving Zones The zones can be create...

Page 77: ...Setup key or use the touchscreen controls to enter the Trigger Menu 2 Use the touchscreen to select Zone 3 The menu shown in figure 9 32 will appear 4 Press the Zone1 Setting option to configure zone...

Page 78: ...ence display allows the verification of bus contention occurring as shown in figure 9 36 Figure 9 36 Persistence Enabled Using the zone trigger is a quick and simple way to capture the interesting wav...

Page 79: ...d bus protocol To select the decoding Bus Protocol 1 Press the Decode key or use the touchscreen controls to enter the Decode Menu 2 Use the touchscreen to enable Bus Operation 3 Use the touchscreen t...

Page 80: ...e trigger voltage level when the trigger type is set to serial Threshold level line It only appears when adjusting the threshold level 8 Touch option to return previous menu The signal settings of dec...

Page 81: ...l be triggered when SDA data is high during any SCL s ACK bit EEPROM The trigger searches for EEPROM control byte the value is 1010xxx on the SDA bus where there is a Read bit and an ACK bit behind EE...

Page 82: ...is set to the same value of the signal s data Both Data1 s and Data2 s values are set and the signal has two consecutive data values the first is value is Data1 and the second data value is Data2 R W...

Page 83: ...C Conditions If EEPROM is selected Touch Limit Range option to set the qualifier or Touch Data1 and set its value by turning the Universal Knob or using the virtual keypad If 7 Addr Data or 10 Addr Da...

Page 84: ...tual keypad The range of the lines is 1 to 7 8 Touch Scroll option and turn the Universal Knob to navigate the available lines Interpreting the I2C Decode The frames of decoding result The address val...

Page 85: ...samples at clock signal s rising edge or falling edge Touch to return previous menu 5 Set MISO Touch MISO to enter the MISO menu Touch MISO to select the channel that is connected to the SPI MISO sign...

Page 86: ...suitable for case where the CS signal is not connected or the number of oscilloscope channels is insufficient such as 2 channel oscilloscopes Table 10 1 CS Type Parameters Example Connect the data CLK...

Page 87: ...is T3 the clock period is T1 then set the timeout to a value between T1 and T3 Figure 10 12 Example 2 If the data width is set to be greater than 8 bits such as 16 bits the clock idle time between 8 b...

Page 88: ...lave Out MOSI Master Out Slave In Table 10 2 SPI Trigger Type 6 Touch Data Length and turn the Universal Knob to set the length of a data The range of data length is 4 to 96 bits 7 Set the value of th...

Page 89: ...coding format of the decoder s result 7 Touch Scroll and turn the Universal Knob to view all frames Interpreting SPI Decode The frames of decoding result The data values are displayed in frames and ar...

Page 90: ...o the TX signal b Touch second Threshold key to set the TX signal s threshold voltage level by Universal Knob The threshold voltage level is for decoding and it will be regard as the trigger voltage l...

Page 91: ...h Condition and set up the desired trigger condition Start the oscilloscope will be triggered at the position of start bit Stop the oscilloscope will be triggered at the position of stop bits Data the...

Page 92: ...Decode2 2 Touch Display and select On to display the result of decoding 3 Touch List to enter the LIST function menu 4 Touch Display key and choose the same options as the first step 5 Touch Lines an...

Page 93: ...lay to show the complete content of a frame and some content is hidden Figure 10 18 UART Decode Bus Display The lists of decoding result Time the horizontal displacement between current frame and trig...

Page 94: ...the trigger type to serial 5 Touch Configure to enter the BUS CONFIG menu 6 Touch Baud to set baud rate by rotating the Universal Knob The baud rate can be set as predefined value from 5kb s to 1Mb s...

Page 95: ...into two bytes a byte includes 8 bits If 1st byte is selected only the 8 least significant bits can be changed If you select the ID DATA condition a Touch ID bits to select the ID s length 11 or 29 b...

Page 96: ...s not enough space on the display to show complete content of a frame and some content is hidden Figure 10 21 CAN Decode Bus Display The list of decoding result Time the horizontal displacement betwee...

Page 97: ...Custom and turn the Universal Knob to set the desired baud rate 10 5 2 LIN Trigger This section provides a brief introduction and description for the operation of the LIN trigger Trigger Condition Br...

Page 98: ...SET menu Touch Condition and select the trigger condition by Universal Knob If you select ID condition Touch ID and set its value by turning the Universal Knob If you select ID DATA condition Touch I...

Page 99: ...pace on the display to show complete content of a frame and some content is hidden Figure 10 24 LIN Decode Bus Display The list of decoding result Time the horizontal displacement between current fram...

Page 100: ...hreshold of the FlexRay signal use the touchscreen to select Protocol Signal 1 The FLX SIGNAL menu will be displayed Figure 10 27 2 Use the touchscreen to select Source and select the source the signa...

Page 101: ...ger copies the trigger settings to decode 5 Touch option to return previous menu The synchronization is not automatic If the settings at one place change a copy operation is necessary to re synchroniz...

Page 102: ...the Bus Operation 3 Touch Bus to select either Bus1 or Bus2 4 Touch Display to select the character encoding format of the decoding s result The bus s vertical position can be adjusted using the Univ...

Page 103: ...me The horizontal offset of the current data frame head relative to the trigger position FID Frame ID symbol occupies a single line of the list PL Valid Data Length HCRC Head Check Code CYC Cycle coun...

Page 104: ...4 The window shown in figure 10 1 will appear with the addition of the Manchester protocol 5 Select the CAN FD bus protocol Protocol Signals To set the source and threshold of the CAN FD signal use th...

Page 105: ...rn previous menu Protocol Copy The signal settings of decoding and triggering are independent To synchronize the settings between decode and trigger select Protocol Copy 1 The DECODE COPY menu will be...

Page 106: ...ches the specified ID ID ID Bits 11 bit or 29 bit and Curr ID Byte 1st 2nd 3rd or 4th byte can be set ID Data The oscilloscope triggers on the data frame that matches the specified ID and data ID ID B...

Page 107: ...displayed in green BRS Bit Rate Switch is displayed in light yellow ESI Error State Indicator is displayed in blue L Data Length is displayed in light yellow D Data is displayed in white CRC is displa...

Page 108: ...er protocol 5 Select the I2S bus protocol Protocol Signals To set the source and threshold of the I2S signal use the touchscreen to select Protocol Signal 1 The I2S SIGNAL menu will be displayed Figur...

Page 109: ...Source Setting window will appear Select the channel that will provide the data signal Use the touchscreen to select Threshold and input the desired threshold Touch option to return previous menu Prot...

Page 110: ...menu will be displayed Figure 10 29 2 Use the touchscreen to select Copy To Trigger or Copy From Trigger 3 Copy To Trigger copies the decode settings to trigger 4 Copy From Trigger copies the trigger...

Page 111: ...the universal knob or virtual keypad The range is 1 64 frames Clip Trigger on a clipped signal Clip signal Volume is greater than the set value and duration reaches the set value Touch Clip Level to s...

Page 112: ...nob after selecting Bus Position 5 Touch to return to the Decode menu 6 Touch Display option and choose the bus option selected in step 3 7 Touch Lines options and set the number of lines by Universal...

Page 113: ...STD 1553B Decode Protocol Signals To set the source and threshold of the MIL STD 1553B signal use the touchscreen to select Protocol Signal 1 The MIL STD 1553B menu will be displayed Figure 10 46 2 U...

Page 114: ...Decode menu 2 Use the touchscreen to enable the Bus Operation 3 Touch Bus to select either Bus1 or Bus2 4 Touch Display to select the character encoding format of the decoding s result The bus s verti...

Page 115: ...10 48 1553B Bus In the decoding list view Time The horizontal offset of the current data frame head relative to the trigger position RTA The RT address Type Type of the word Data Data values Error Err...

Page 116: ...to select Bus Protocol 4 The window shown in figure 10 1 will appear with the addition of the Manchester protocol 5 Select the SENT bus protocol Protocol Signals To set the source and threshold of the...

Page 117: ...e sync pulse is valid for decoding the data 5 Use the touchscreen to set the Idle Level to Low or High 6 Use the touchscreen to select of Nibbles Use the Universal Rotary Knob or the virtual keypad to...

Page 118: ...synchronize Figure 10 52 Decode Copy 10 10 2 SENT Trigger To select SENT Trigger 1 Touch the Trigger dialog box to display the Trigger menu Figure 10 53 2 Touch the Type option and select Serial 3 Us...

Page 119: ...be specified as Equal Not Equal Less than Less or Equal Greater than Greater or Equal in Range of out of Range At Pos determines the start position of the trigger data If selected as Value you need t...

Page 120: ...t message ID the configuration bit is 0 When the trigger condition is set to Slow Channel ID can be selected in the hexadecimal range of 0x0 to 0xF short serial enhanced serial with 4 bits IDor 0x00 t...

Page 121: ...ata or checksum pulse periods are checked Fast Channel CRC Error triggers on any Fast Channel Message CRC error Slow Channel CRC Error triggers on any Slow Channel Message CRC error All CRC Errors tri...

Page 122: ...s For Fast Channel SYNC is displayed in pink STATE is displayed in green DATA is displayed in white CRC and Pause pulse are displayed in blue Figure 10 58 SENT Fast Channel For Slow Channel ID is disp...

Page 123: ...orizontal offset of the current data frame head relative to the trigger position Sync Sync pulse width only fast channel State Status Communication nibble only fast channel ID ID of the frame only slo...

Page 124: ...touchscreen to select Bus Protocol 4 The window shown in figure 10 1 will appear with the addition of the Manchester protocol 5 Select the SENT bus protocol Protocol Signals To set the source and thre...

Page 125: ...tarting edge of the Manchester signal The range is 1 to 32 6 Use the touchscreen to select Idle Bits Set the minimum idle time inter frame gap time of the Manchester bus in terms of the bit width 7 Us...

Page 126: ...1 2 Manchester Serial Decode Once the setup for the Manchester signal and trigger has been completed the decoding operation must be setup 1 Touch Decode key to display the Decode menu 2 Use the touchs...

Page 127: ...Serial Trigger and Decode 127 Figure 10 63 Manchester Bus...

Page 128: ...st a rough adjustment is achieved by using gestures and then a fine adjustment is achieved by using the universal knob To enable Cursors 1 Press the Cursors key to open the Cursor menu 2 Press the Cur...

Page 129: ...zontally and can be used to measure time when the source is FFT waveform X cursors measure frequency X1 cursor is the left default position vertical dotted line it can be moved to any place of the scr...

Page 130: ...r Mode 11 2 Y Cursors Figure 11 4 X Cursors Y cursors are horizontal dotted lines that adjust vertically and can be used to measure voltage V or current A When the cursors source is the math function...

Page 131: ...ved to any vertical place of the screen Use the Universal Knob to set the Y1 and Y2 cursor values and the values are displayed in the cursors box along with the difference between Y1 and Y2 Y See figu...

Page 132: ...3 Display Style Fixed The position information of each cursor is attached to the cursor and the difference information is between the two cursors with arrows connected to the cursors Figure 11 6 Fixed...

Page 133: ...ence of X cursors and Y cursors Position when the horizontal vertical scale is changed the X Y cursors remain fixed to the grid position on the display Delay Offset when the horizontal vertical is cha...

Page 134: ...grid position on the display Cursor Y Ref Fixed Offset When the vertical scale is changed the value of Y cursors remains fixed Fixed Position When the vertical scale is changed the y cursors remain fi...

Page 135: ...the grid number of X cursors 1div 2div remains fixed The value of X1 and X2 are changed to 100 ns 200 ns Figure 11 10 Example 3 Fixed delay timebase is changed to 100 ns div the value of X cursors 50...

Page 136: ...ome parameter measurements such as period accumulate all measurements in a frame but the displayed value is always the first value Thedistribution of multiple parameters in one frame is displayed in t...

Page 137: ...5 specified basic measurement parameters of the selected channel Statistics and Histogram are available for M1 display Statistics and Histogram Enabled Statistics and Histogram Disabled Figure 12 3 Ad...

Page 138: ...red measurement The corresponding parameters of the selected tab will be displayed below the tab area 4 Use the touchscreen to select the desired measurement A source must be selected before selecting...

Page 139: ...nput waveform 3 Peak Peak Difference between maximum and minimum data values 4 Top Value of most probable higher state in a bimodal waveform 5 Base Value of most probable lower state in a bimodal wave...

Page 140: ...t FOV and ROV Overshoot is distortion that follows a major edge transition expressed as a percentage of Amplitude ROV means rising edge overshoot and FOV means falling edge overshoot Figure 12 8 Overs...

Page 141: ...ope 3 Time max Time of maximum value 4 Time min Time of minimum value 5 Width Width measured at 50 level and positive slope 6 Width Width measured at 50 level and negative slope 7 Duty Ratio of positi...

Page 142: ...of the waveform below zero 3 Area DC Area of the waveform 4 AbsArea DC Absolute area of the waveform 5 Area AC Area of the waveform above average 6 Area AC Area of the waveform below average 7 Area A...

Page 143: ...5 FFFRThe time between the first falling edge of source A and the following first rising edge of source B at the middle threshold 6 FFFFThe time between the first falling edge of source A and the fol...

Page 144: ...rend operation 1 Touch the Tools option in the measure menu 2 Touch the Trend option to display the dropdown menu with the available options 3 Select the desired measurement 4 Press the Clear Sweep ke...

Page 145: ...Statistics option in the measure menu Enabling statistics displays the distribution of the measured values of every selected parameter Figure 12 16 Statistics Enabled Value The current measurement Mea...

Page 146: ...ogram Enlarged 12 8 Gate The Gate function is useful to measure parameters for a certain specified time range of the signal and ignore signal parts that lie outside of that range To configure the gate...

Page 147: ...displayed 3 Set the amplitude calculation strategy When set to auto the amplitude calculation strategy will be selected automatically according to the input signal to ensure the accuracy of the measur...

Page 148: ...gure 12 22 will be displayed 3 Set the type of threshold Percent Set according to the percentage of waveform The setting range of lower value and upper value is 1 99 and the low value shall not be gre...

Page 149: ...the Math key or touch the icon in the channel descriptor box region and select Func1 or Func2 The Math menu shown in figure 13 1 will be displayed 2 Touch the Operation option to toggle the math funct...

Page 150: ...ation Unit Addition or Subtraction V A or U used when the units of two sources are not consistent multiplication x 2 2 division None Resistance unit Ohms S conductance unit Siemens FFT dBVrms Vrms dBm...

Page 151: ...e B values are added or subtracted point by point and the result is displayed 1 In the Function window touch the Source A The Source Setting window shown in figure will be displayed 2 Select the desir...

Page 152: ...available the resulting average has a random noise component lower than that of a single shot record The more frames that are accumulated the lower the noise is Figure 13 4 Average Example Average ac...

Page 153: ...ignal to be periodic nor does it require stable triggering but due to the digital filtering the system bandwidth of the oscilloscope will degrade when acquiring data in ERES mode The higher the enhanc...

Page 154: ...The range of dx in the d dt menu is 4 256 Use differentiate to measure the instantaneous slope of a waveform For example the slew rate of an operational amplifier may be measured using the differentia...

Page 155: ...enter a DC offset correction factor for the input signal Small DC offset in the integrate function input or even small oscilloscope calibration errors can cause the integrate function output to ramp u...

Page 156: ...ntegral Gate 13 3 3 Square Root Square root calculates the square root of the selected source Where the transform is undefined for a particular input holes zero values appear in the function output Fi...

Page 157: ...Figure 13 10 Absolute Operation 13 3 5 Sign In mathematics the sign function or signum function from signum Latin for sign is an odd mathematical function that extracts the sign of a real number The s...

Page 158: ...h 158 Figure 13 11 Sign Operation 13 3 6 Exp Exp10 The exponential operation includes the exponential operation based on constant e and the exponential operation 10 based on 10 Figure 13 12 Exp Operat...

Page 159: ...ero For example F1 where x is the trigonometric wave function F2 lg F1 Figure 13 13 Ln Lg Operation 13 3 8 Interpolate Between the adjacent sampling points the waveform is interpolated according to th...

Page 160: ...tion according to different waveforms andtheir characteristics Refer to table 13 3 to make an appropriate option according to the input signal 4 Touch Full Span to view the full span of the frequency...

Page 161: ...ther type of window Hanning These reduce leakage and improve amplitude accuracy However frequency resolution is also reduced Hamming These reduce leakage and improve amplitude accuracy However frequen...

Page 162: ...ts to calculate the spectrum In this example FFT sample rate 1 GSa s 4 250 MSa s FFT points Curr The current FFT points which is an integer power of 2 up to 2 M points 2097152 to be exact Frequency in...

Page 163: ...up to 10 qualified peak points and mark them on the FFT waveform 13 5 1 Peaks Tool To configure the Peaks tool 1 Press the Math to open the math menu 2 Touch the Tools option 3 Touch Type and select P...

Page 164: ...s to automatically mark each harmonic of the FFT waveform 7 Touch Show Table to toggle the table on or off 8 Touch Show Frequency to toggle the frequency column on or off 9 Touch Show Delta to toggle...

Page 165: ...ath X1 and X2 cursors can be used to measure the frequency value at the cursor position Only the maximum parameter of the FFT is supported in automatic measurement DC components in the signal may show...

Page 166: ...ure 13 25 will be displayed Figure 13 25 Formula Editor A Formula display text box B Text box operation area which can clear and modify the entered formula C Special operators D Operation source Cx re...

Page 167: ...waveforms 4 Touch the Save icon to save the channel or math waveform to the appointed location The vertical scale information and the vertical offset of the waveform will be saved at the same time It...

Page 168: ...Reference Waveform 168 Figure 14 1 Recall REFB...

Page 169: ...egative Limit Range includes four types and Users can select the desired type and then input the time value Interval Slope includes Rising Falling Limit Range includes four types and Users can select...

Page 170: ...Search 170 Figure 15 1 Search in Run When the acquisition is stop EVENT NUM 4 7 means current event number total events number the current event is the closest event to the middle of the screen...

Page 171: ...ere are two ways to navigate by time Touch the Time area to set the time value by the universal knob or the virtual keypad Touch the navigation options in the Navigate menu to play backward stop or pl...

Page 172: ...the event number by the universal knob or the virtual keypad Touch the navigation option or to go to the previous or next search event 4 Touch the Event List Switch area to turn on or off the list Th...

Page 173: ...ype as History Frame 3 Touch Frame to set the frame number by the universal knob or the virtual keypad Touch the navigation options on to play backward stop or play forward 4 Touch Playing Mode to set...

Page 174: ...ell as be declared through the system sound or a pulse output from the Aux Out connector on the rear panel The Pass Fail test only operates on analog channels that are displayed This is very useful to...

Page 175: ...mask to the trace in horizontal with the unit of division 3 Touch Mack Y to set the spacing of the mask to the trace in vertical with the unit of division 4 Touch Create Mask to create the mask based...

Page 176: ...includes ordinary file operations such as New Create a new mask file Open Open an existed mask file Save Save the current mask file Exit Exit the Mask Editor tool The contents of the Edit menu are eq...

Page 177: ...e X ordinate and Y ordinate by the virtual keypad and then touch the Input button the perform the ordinate update F Display or hide coordinate of polygon vertices on the display G Exit the tool To edi...

Page 178: ...e mask will be recognized as a pass All data points outside the mask will cause a failure Any Out Any data point outside the mask will be recognized as a pass All data points inside the mask will caus...

Page 179: ...urce to select an analog channel 5 Touch Level to adjust the level of the counter using the Universal Knob or the virtual keypad 6 Touch Statistics to toggle the statistics table on and off 7 Touch Re...

Page 180: ...the gate source meets the specified conditions Touch Gate Setting to display the counter gate menu 1 Touch Gate to toggle on and off the gate 2 Touch Type to toggle between Level and After Edge gate t...

Page 181: ...r Quality Current Harmonics Inrush Current Switching Loss Slew Rate Modulation Turn On Turn Off Transient Response PSRR Power Efficiency Output Ripple etc Full use of the Power analysis requires a dif...

Page 182: ...er reactive power power factor power phase angle voltage effective value current effective value voltage crest factor and current crest factor of power input of a switching power supply 19 1 1 Type Po...

Page 183: ...rrent effective value and current crest factor 19 1 2 Input Setup 1 Touch Input Setup to display the signal menu shown in figure 19 3 2 Touch Input Voltage to set the input voltage source 3 Touch Inpu...

Page 184: ...isplay type Off Bar Chart or Table Figure 19 4 Harmonics Analysis Menu 19 2 2 Standard IEC 61000 3 2 is an international standard that limits mains voltage distortion by prescribing the maximum value...

Page 185: ...standard The rows in the table or the bars in the bar chart are rendered in different colors based on the pass fail state When the value is greater than 85 of the limit but less than 100 of the limit...

Page 186: ...age to set the input voltage source 3 Touch Input Current to set the input current source 4 Touch Expected I to set the expected current value The range is 100 mA to 500 A The oscilloscope will set th...

Page 187: ...when the current is close to zero This is a typical oscilloscope dynamic range limitation when trying to measure weak voltage and or current in the presence of relatively large switching voltage and...

Page 188: ...ue is used to determine the threshold hysteresis of the switch edge 5 Touch Conduction to set the conduction type Waveform Rds on or Vce sat 6 Touch Rds On and turn the Universal Knob or use the virtu...

Page 189: ...Input Voltage to set the input voltage source 3 Touch Input Current to set the input current source 4 Touch Auto Deskew to automatically deskew 5 Touch Connection Guide to display a diagram illustrati...

Page 190: ...switching Figure 19 13 Slew Rate 19 5 1 Connection Guide Touch Signal Connection Guide to recall the connection guide of slew rate as shown in figure 19 14 Follow the instructions in the figure for co...

Page 191: ...Input Modulation 1 Touch Input Setup to display the signal menu shown in figure 19 15 2 Touch Input Voltage to set the input voltage source 3 Touch Input Current to set the input current source 4 Tou...

Page 192: ...19 7 1 Output Ripple Input Setup 1 Touch Input Setup to display the signal menu shown in figure 19 17 2 Touch Output Voltage to set the input voltage source 3 Touch Duration and turn the Universal Kn...

Page 193: ...e the range is 5 ns 20 s The oscilloscope will set the timebase according to the value duration 10 5 Touch Max V in RMS and turn the Universal Knob or use the virtual numeric keypad to set the maximum...

Page 194: ...m amplitude T2 When the output DC voltage rises to a certain percentage usually 90 of its maximum amplitude Turn Off Defines the time that has elapsed after a power supply has been turned off and has...

Page 195: ...nob or use the virtual numeric keypad to set the duration time the range is 5 ns 20 s The oscilloscope will set the timebase according to the value duration 10 5 Touch Stable V out and turn the Univer...

Page 196: ...uch High Current and turn the Universal Knob or use the virtual numeric keypad to set the input high current value This is the expected high current value before or after the load change Figure 19 23...

Page 197: ...RR measured by the oscilloscope is difficult to exceed 60 dB The PSRR test is generally acceptable for sampling the overall PSRR behavior of the power supply under test 19 10 1 PSRR Configuration The...

Page 198: ...shown in figure 19 26 2 Touch Input Voltage to set the input voltage source 3 Touch Input Current to set the input current source 4 Touch Output Voltage to set the output voltage source 5 Touch Outpu...

Page 199: ...mplitude and phase plots To enable the Bode Plot function 1 Touch Analysis Bode Plot to display the bode plot menu 2 The Bode Plot menu shown in figure 20 1 menu will be displayed 3 Touch Bode Plot to...

Page 200: ...automatically adapt the vertical scale according to the signal amplitude When it is set to Hold it will always keep the currently selected vertical scale If signals overload the selected range in Hold...

Page 201: ...be linear or decade When it is set to linear the corresponding center frequency and span frequency need to be set When it is set to decade the corresponding start frequency and stop frequency need to...

Page 202: ...profile Up to 4 profiles can be edited C Set the frequency mode D Set the number of sweep points E Set the offset of the sweep signal F Set the signal amplitude unit When it is set to dB reference lev...

Page 203: ...rough the universal knob or touch to increase the nodes and to decrease Touch the cell in the table area to set the frequency and amplitude of the corresponding node Touch to activate the cell adjust...

Page 204: ...e Frequency Amplitude Offset Duty Ramp Frequency Amplitude Offset Symmetry Pulse Frequency Amplitude Offset Duty DC Offset Noise Stdev Mean Arb Frequency Amplitude Offset Arb Type Table 21 1 Waveforms...

Page 205: ...ed with CH1 of the oscilloscope Connect the output of AWG to CH1 of the oscilloscope press Auto and the AWG will start to automatically adjust The scope will display Zero adjust completed when the adj...

Page 206: ...oscilloscope saves the screen image in external memory in png format You can specify the file name and saving directory under the same directory using the same file name The recall of image is not su...

Page 207: ...Internal External Save and Recall Internal save and recall support Setups in Save Recall In the following part the save and recall method and procedures are introduced Save the specified oscilloscope...

Page 208: ...n menu 3 Touch Recall to select Save mode 4 Touch Type to select the type of format 5 Touch File Manager to open the file manager window shown in figure 22 3 6 Touch Local to recall the file internall...

Page 209: ...ag on the left of the folder indicates that the folder includes subfolder s Clicking the tag expands the folder to show the subfolder s in the left window Right Window Displays the files and the subfo...

Page 210: ...Save Recall 210 Figure 22 4 Save As...

Page 211: ...the current Uboot and OS version of the oscilloscope FPGA Version list the current fpga version of the oscilloscope CPLD Version list the current CPLD version of the oscilloscope Hardware Version list...

Page 212: ...t The oscilloscope provides the following input output interfaces USB LAN and Aux Output 23 4 1 LAN To set the oscilloscope to communicate with PC via LAN 1 Connect the oscilloscope to your local area...

Page 213: ...l to enter the Utility menu 4 Touch System Setting to view the System Setting menu 5 Touch IO Set to enter the I O Setting menu 6 Touch USB ID to view the USB ID Figure 23 3 USB ID 23 4 3 Date Time 1...

Page 214: ...sition on the display 1 Press the Utility key on the front panel and touch Reference Pos to enter the Reference POS menu 2 Touch Vertical Ref to select Offset or Position Position when the vertical ga...

Page 215: ...est menu 3 Press the Screen Test softkey to enter the screen test interface as shown in figure 23 6 Figure 23 6 Screen Test 4 Press the Single key on the front panel continually as it says in the pict...

Page 216: ...ter the keyboard test interface as the picture shown below Figure 23 7 Keyboard Test 4 To perform the knobs and the keys test Knobs test The default value is 0 Turn left to increase the value while tu...

Page 217: ...icture shown below Figure 23 8 LED Test 4 According to the prompting information displaying on the screen press the Single key continually to light the key lights one by one The first time to press th...

Page 218: ...nel to enter the Utility menu 3 Touch Start Self Cal and it will pop up the following dialog Select Continue to start the self cal program 4 The oscilloscope will not respond to any operation until th...

Page 219: ...provides an approach to control the oscilloscope by a web browser It doesn t require any additional software to be installed on the controlling computer Set the LAN port correctly see section LAN for...

Page 220: ...24 2 Interface 24 2 Other Connectivity The 2560B series also supports remote control of the instrument by sending SCPI commands via NI VISA Telnet or Socket For more information refer to the programm...

Page 221: ...wire is correctly connected to the BNC namely channel connector 3 Check whether the probe is correctly connected to the item to be tested 4 Check whether there are signals generated from the item to...

Page 222: ...between the sample points may cause ladder like display Set Type to Dots to solve the problem Fail to connect PC through USB Check the IO Setting in Utility to make sure whether the setting in USB Dev...

Page 223: ...probes connectors and accessories that you are using with the device Customers not on an open account must include payment in the form of a money order or credit card For the most current repair charg...

Page 224: ...ia our website www bk precision com Exclusions This warranty does not apply in the event of misuse or abuse of the product or as a result of unauthorized alterations or repairs The warranty is void if...

Reviews: