


Chapter 6
Statistics
Evia HF / HF-T Technical Manual
PAGE 79
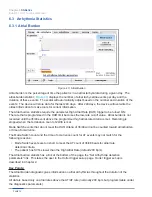
Figure 48: Pulse Amplitude Histogram
The Pulse amplitude histogram, shown in
, displays the pulse amplitude of each paced
event during the recording period. This data is displayed in the respective bins by count and overall
percentage. If Evia HF / HF-T is not programmed to ACC/VCC or ATM, this page will only show the
programmed output value.
Important note: In addition to each paced event being counted, Evia HF / HF-T will also count each
output during the capture control test.
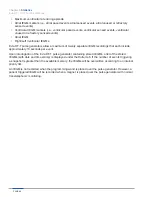
6.5.4 Capture Control Status
The Capture Control Status displays the status, threshold last value (including time and date), current
pacing amplitude, and reason for ACC or RVCC/LVCC being disabled or suspended (if applicable).
Figure 49: Capture Control Status
The Capture Control Status in
Figure 49
shows data related to Capture Control testing. The data
shown includes the current status, the last measured threshold, the date and time of the last
measurement and any note or comments related to capture control testing. Notes will display the
reasons that ACC or VCC was not completed. These reasons may include:
Summary of Contents for Evia HF
Page 1: ...Cardiac Rhythm Management Heart Failure Therapy Evia HF HF T Evia HF HF T Technical Manual...
Page 8: ...Chapter Table of Contents Evia HF HF T Technical Manual PAGE vi...
Page 12: ...Chapter 2 Indications Evia HF HF T Technical Manual PAGE 4...
Page 14: ...Chapter 3 Contraindications Evia HF HF T Technical Manual PAGE 6...
Page 98: ...Chapter 7 Product Storage and Handling Evia HF HF T Technical Manual PAGE 90...
Page 104: ...Chapter 9 Lead Connection Evia HF HF T Technical Manual PAGE 96...
Page 118: ...Chapter 10 Elective Replacement Indication ERI Evia HF HF T Technical Manual PAGE 110...
Page 130: ...Chapter 13 Order Information Evia HF HF T Technical Manual PAGE 122...
Page 132: ...Chapter 14 Order Information Evia HF HF T Technical Manual PAGE 124...
Page 136: ...PAGE 128 Appendix A Evia HF HF T Technical Manual...