45
GV Node
User Manual
The three
Timing Status icons
below the slider should all be green. If they are not, you
will need to verify the condition of your network.
3 Move the slider back towards the zero setting, until you see icons flashing Red.
4 Move the slider incrementally up until the red flashing stops.
This setting should be satisfactory for your network as it is now configured. If you
change the network, you may need to repeat this process.
You can see the latency you have added in the three
Total Delay
windows (SD, HD, 3G). The
time values are different because of the different data rates between the standards.
Alarms
The fabric module generates alarms which are sent to the GV Node controller card when
error conditions are detected. These alarms are used to set the control panel status display,
and the status icon in the top left of the iControl window.
The alarms are reported to the iControl network, and can be reported locally on the frame’s
GPI port.
GPI reporting can only be accessed from the menu, as described at the end of this section
(page 32).
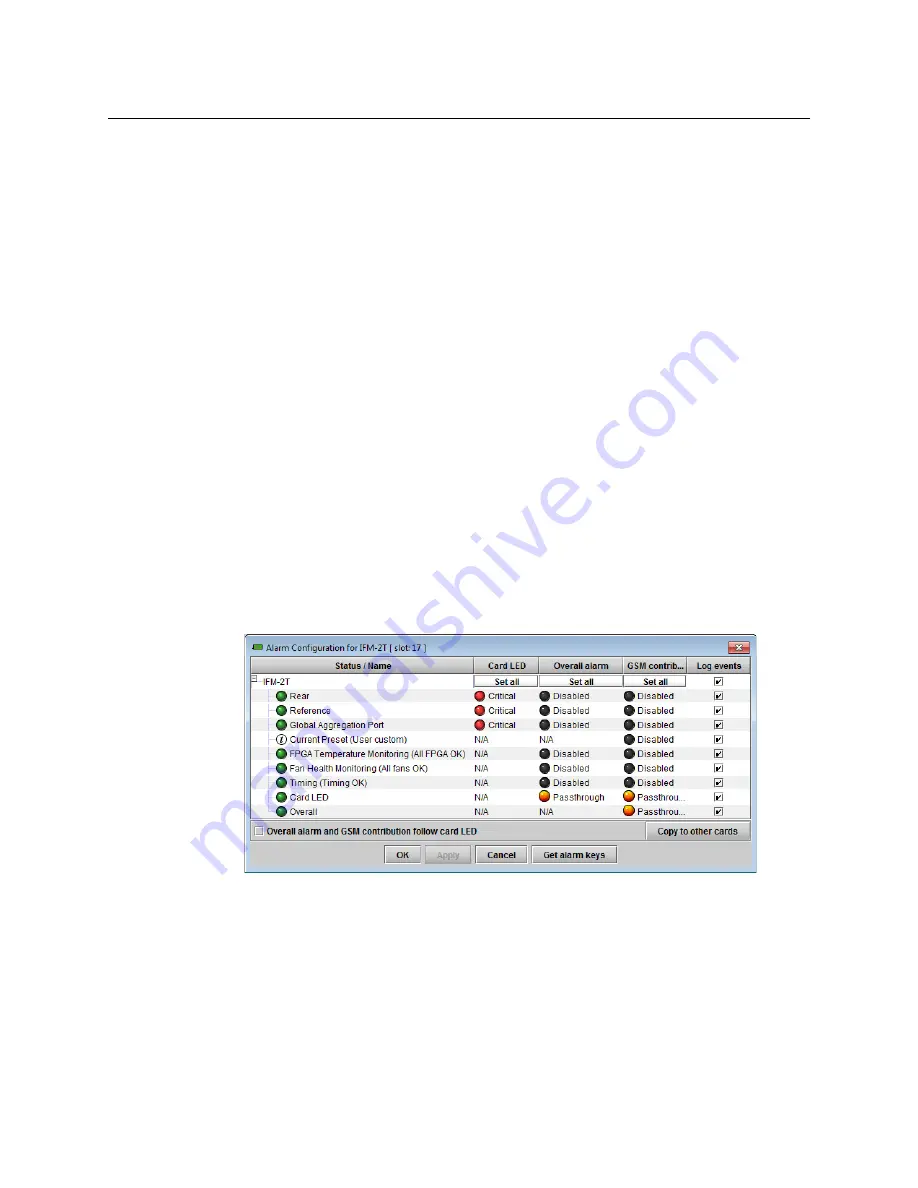
To configure the alarms
1 Click
Alarm Config
.
The Alarm Configuration panel opens in a new window, and can be resized if needed. It
allows the alarm reporting of the module to be configured. The panel is organized in
columns.
2 For each line in the Status/Name column:
a Click on the icon in the Overall Alarm column
b Click to select the appropriate alarm status from the drop-down list


