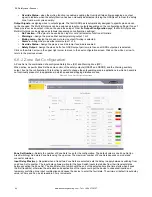
4. Click
Home
to start at the home page of the configuration software and select
Open a Safety System Configuration
from PC
.
5. Navigate to the desired file and select it.
6. Select
Programming
in the gray bar (starts the discovery process) and select the appropriate scanner.
7. When the appropriate scanner is shown in the panel to the right, select the white arrow in the upper right.
The programming page opens.
8. Click
Load
and click
OK
to the notice that the configuration was validated.
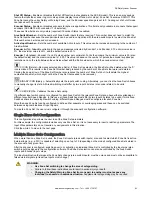
9. Enter the password (default password is admin) and click
OK
for the warning that the device will switch off.
The configuration will start to load into the scanner. This can take up to two minutes.
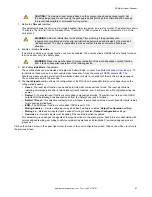
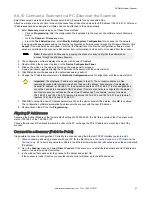
10. After the programming has finished loading, perform a field validation. For more information, see
•
If the configuration is deemed safe, finish loading the configuration by clicking
Accept
.
•
If the configuration is not deemed safe, click
Reject
to return to the previous configuration.
The process may take up to one minute to finish.
6.6.13 Monitor the Scanner
When in the
Monitoring
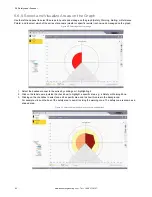
mode, the graph displays the current working area of the scanner. Use this function to verify that the
designed Safety and Warning Zones are designed correctly (provide the desired protection).
This function is also used to watch the functioning of the scanner during operation. The
Monitoring
function is only available
when an online scanner has been selected.
Tip:
If you click on
Monitoring
and receive a message that the scanner is busy, verify that the software
has access through the Window's firewall.
With the Monitoring function, the following information can be checked:
•
OSSD status (on/off)
•
Connector pin assignment (colors and functions)
•
Locations of objects in the field of view of the scanner (in the Safety and/or Warning zones)
•
Diagnostic errors that caused the OSSDs to turn off
•
Surrounding area detected by the scanner in real time
•
Switching of the Zone Sets
•
Configured parameters
•
Presence of reflective surfaces and/or light sources (if selected)
On the left panel, the software displays the scanner status (if it is currently functioning). It is also possible to view some
parameters like response time by clicking on the Parameters icon, view pin assignments by clicking on the Connector icon, or
view fault information by clicking on the Diagnostic icon.
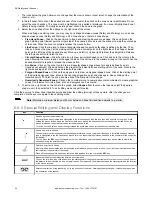
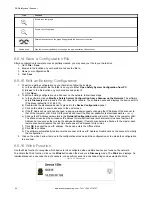
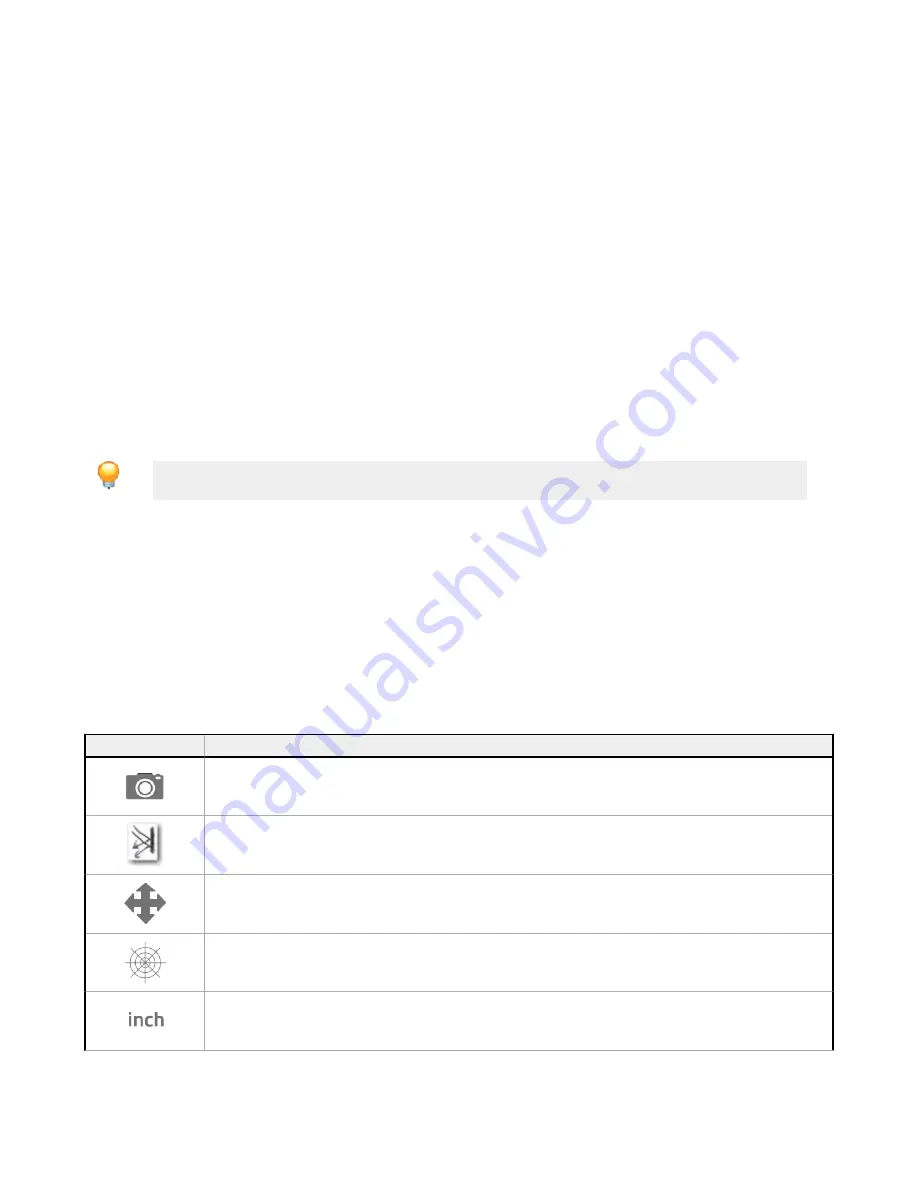
The following icons, located on the right side of the graph, allow the users to manipulate the display.
Icon
Function
Saves the Monitoring information into a .txt file
Shows areas of high light input areas (reflective surfaces or light sources are being seen by the scanner)
Moves the graph origin on the page.
After clicking on the button, click and hold on the graph to move it around (up, down, right or left). After you position the graphic,
release the mouse button. Click on the icon again to set the location.
Toggles the graph polar (r, θ) and Cartesian (x, y) coordinates.
Toggles the graph unit of measure between mm and inches.
SX Safety Laser Scanner
www.bannerengineering.com - Tel: + 1 888 373 6767
95


