Note:
The measurement units that appear in these prompts
are those selected in the GLOBL-SYSTM menu. Also, when
differences in one channel’s programming invalidates
an output previously chosen for the other channel, the
measurement defaults to the nearest selectable item in the
parameter list.
The previous two prompts repeat until all of the specified
#
of LCD Parameters
have been set up. When all of the display
parameters have been set up, the meter returns to the
Global I/O
window. To leave the
Keypad Program
, press [
]
three times.
After leaving the
Keypad Program
, the
PanaFlow Z1G/Z2G
Process Gas Flowmeter
resets itself and begins to display
the parameters specified in this section. If more than one
parameter was set up, each of the parameters is displayed
in sequence, with a pause of several seconds between
display changes.
To use the programmed LCD display to obtain flow rate
data, simply power on the
PanaFlow Z1G/Z2G Process Gas
Flowmeter
as described earlier in this chapter. Then, read
the flow rate directly from the display (see
Figure 17 on page
23
).
4.5.2 Programming the PanaView display
Launch the
PanaView
software on the PC and establish
communications with the
PanaFlow Z1G/Z2G Process
Gas Flowmeter
(see the
PanaView
manual, Panametrics
document #910-211 as necessary). Then, enter the
required
startup parameters
, as described in
Chapter 3, “Initial
Setup”
. Proceed as follows:
1. In
PanaView
, open the
Output
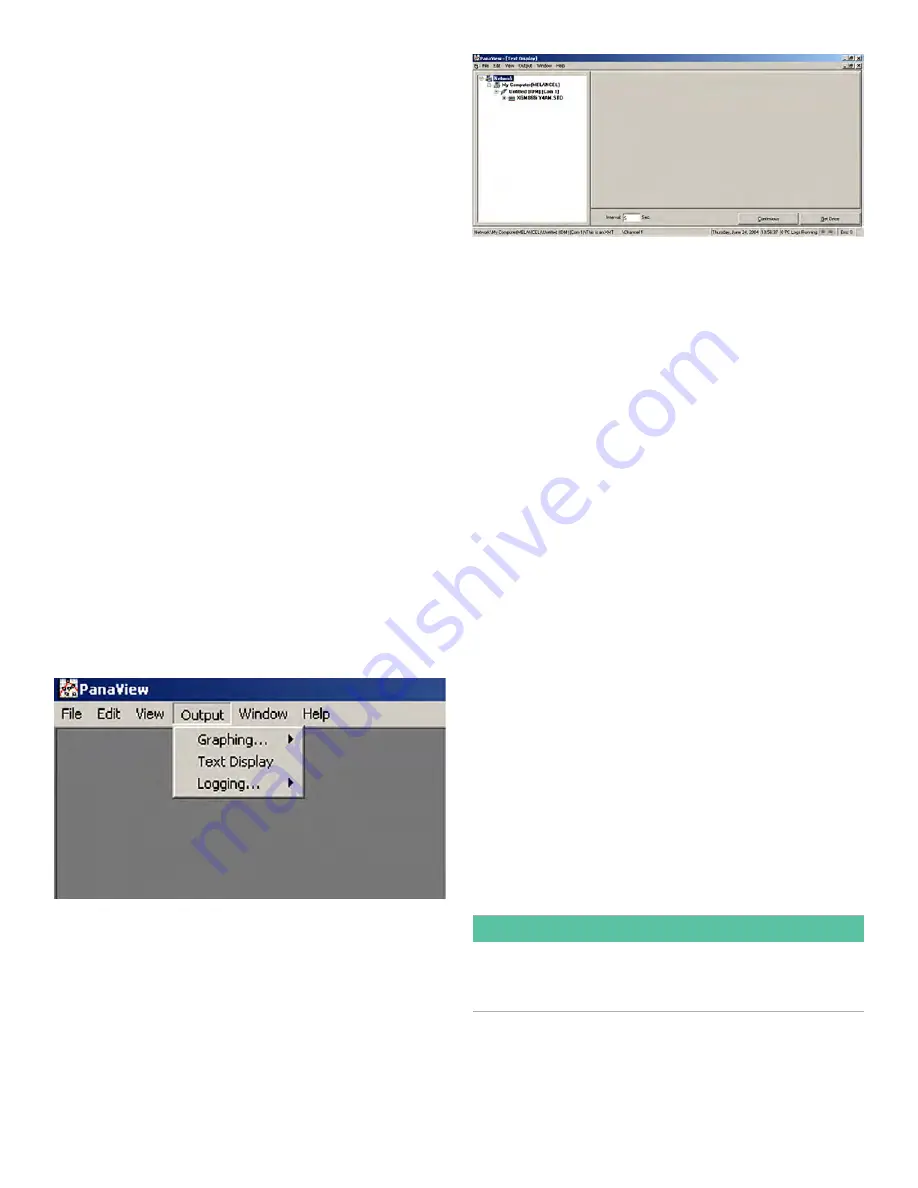
menu (see
Figure 19
below)
and click on the
Text Display
option.
Figure 19: The output menu
Note:
The Text Display window is actually stacked on top
of any previously opened PanaView windows, such as the
Meter Browser window.
2. Using the
Window
menu, as described in the
PanaView
manual
, arrange the open windows in the desired
format. For this discussion, Figure 20 shows the
Text
Display
window in its maximized (full-screen) size.
Figure 20: The text display window
3. The left pane of the
Text Display
window contains the
standard
PanaView
network tree. Expand the branch
for your
PanaFlow Z1G/Z2G Process Gas Flowmeter
model, and double-click on the desired channel. On
2-channel units, you can also display the
SUM, DIFF
or
AVG
parameters.
4. From the expanded tree, double-click on the desired
flow parameter
to display it in the right pane of the
window.
5. Before actual data values can be displayed in the text
pane, activate one of the following data collection
modes (see
Figure 20 above
):
• Click on the
[Get Once]
option button at the bottom of
the right pane in the
Text Display
window. The current
value of the selected process parameter, as specified in
the
PanaView
network tree, is displayed in the right pane
of the
Text Display
window.
• Enter an
Interval
in the text box at the bottom of the
right pane in the
Text Display
window, or check the
Max. Comm Rate
box to collect readings as fast as the
system allows (i.e., 1 sec). Then, click on the
[Continuous]
option button to begin collecting data for display in the
right pane of the
Text Display
window. The right pane
now appears similar to
Figure 18 on page 24
.
Note:
Any value entered in the Interval text box is overridden
if the Max. Comm Rate box is checked.
6. If the
[Continuous]
option was selected in Step 5, click
on the
[Stop]
option button, which has replaced the
original
[Continuous]
option button, to terminate data
collection.
The
Text Display
window may be left open while other tasks
are performed, or it may be closed by clicking on the
lower
[
] control button at the far right of the menu bar.
IMPORTANT:
If you click on the upper [X] control button at the far right
of the PanaView title bar, you will exit PanaView completely.
26
Summary of Contents for PanaFlow Z1G
Page 1: ...PanaFlow Z1G Z2G User s manual 910 321 Rev A...
Page 2: ...ii...
Page 4: ...no content intended for this page iv...
Page 9: ...no content intended for this page 1...
Page 21: ...Figure 12 Remote mount electronics transducer and preamplifier wiring ref dwg 702 731 732 13...
Page 28: ...no content intended for this page 20...
Page 30: ...no content intended for this page 22...
Page 38: ...no content intended for this page 30...
Page 40: ...no content intended for this page 32...
Page 43: ...Table 13 Service record cont Date Description of service Performed by 35...


