


4.13 Time Domain Graph Display
4-183
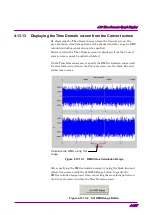
4.13.3 Displaying time domain graph by reading file
A waveform pattern generated by a signal generation application of the
IQproducer
TM
can be read and displayed in a Time Domain graph.
■Time domain graph display using Add button
<Procedure>
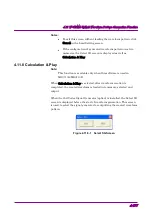
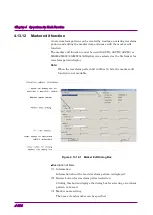
1. Click one of the option buttons in the Legend dialog box to select the
trace color of the waveform pattern in the CCDF graphical area.
Figure 4.13.3-1 Legend Dialog Box
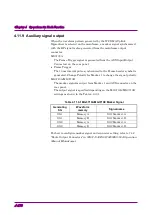
2. Click the Add button to display the Add Trace dialog box.
The Add button is disabled when any other waveform pattern is
already specified on the selected option button. In such a case, delete
the waveform pattern by clicking the Delete button, or click one of
other option button.
Figure 4.13.3-2 Add Button
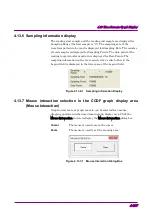
Otherwise, select Add Trace from the File menu.
Figure 4.13.3-3 Add Trace Button on The File Menu