


UG-1882
Rev. 0 | Page 18 of 28
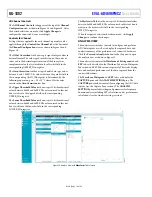
All Channel Controls
The
All Channel Controls
tab appears at the top of the
Channel
Configuration
view as shown in Figure 18 and Figure 19. After
the desired selections are made, click
Apply Changes
to
configure the connected device accordingly.
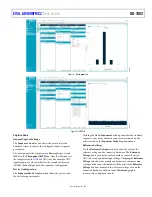
Controls for Channel
Settings that are applicable for each channel separately can be
applied through the
Controls for Channel
tab at the bottom of
the
Channel Configuration
view, as shown in Figure 18 and
The
Offset Correction
text box accepts signed integer values in
decimal format. The value typed into this control has units of
codes and is the decimal representation of the binary, twos
complement value that is stored into the offset bit field in the
corresponding OFFSET_INn register.
The
Gain Correction
text box accepts double data type values
between 0 and 1.99997. The value written to the gain bit field in
the corresponding GAIN_INn register is determined by the
following expression: gain = M × (2
15
), where M is the value
entered in the
Gain Correction
text box.
The
Upper Threshold Value
text box accepts 12-bit hexadecimal
values between 0x000 and 0xFFF. The value entered in this text
box is written to the upper bit field in the corresponding
UPPER_INn register.
The
Lower Threshold Value
text box accepts 12-bit hexadecimal
values between 0x000 and 0xFFF. The value entered in this text
box is written to the lower bit field in the corresponding
LOWER_INn register.
The
Hysteresis Value
text box accepts 12-bit hexadecimal values
between 0x000 and 0xFFF. The value entered in this text box is
written to the hysteresis bit field in the corresponding
HYST_INn register.
When the required selections have been made, click
Apply
Changes
to confirm the changes.
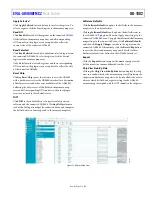
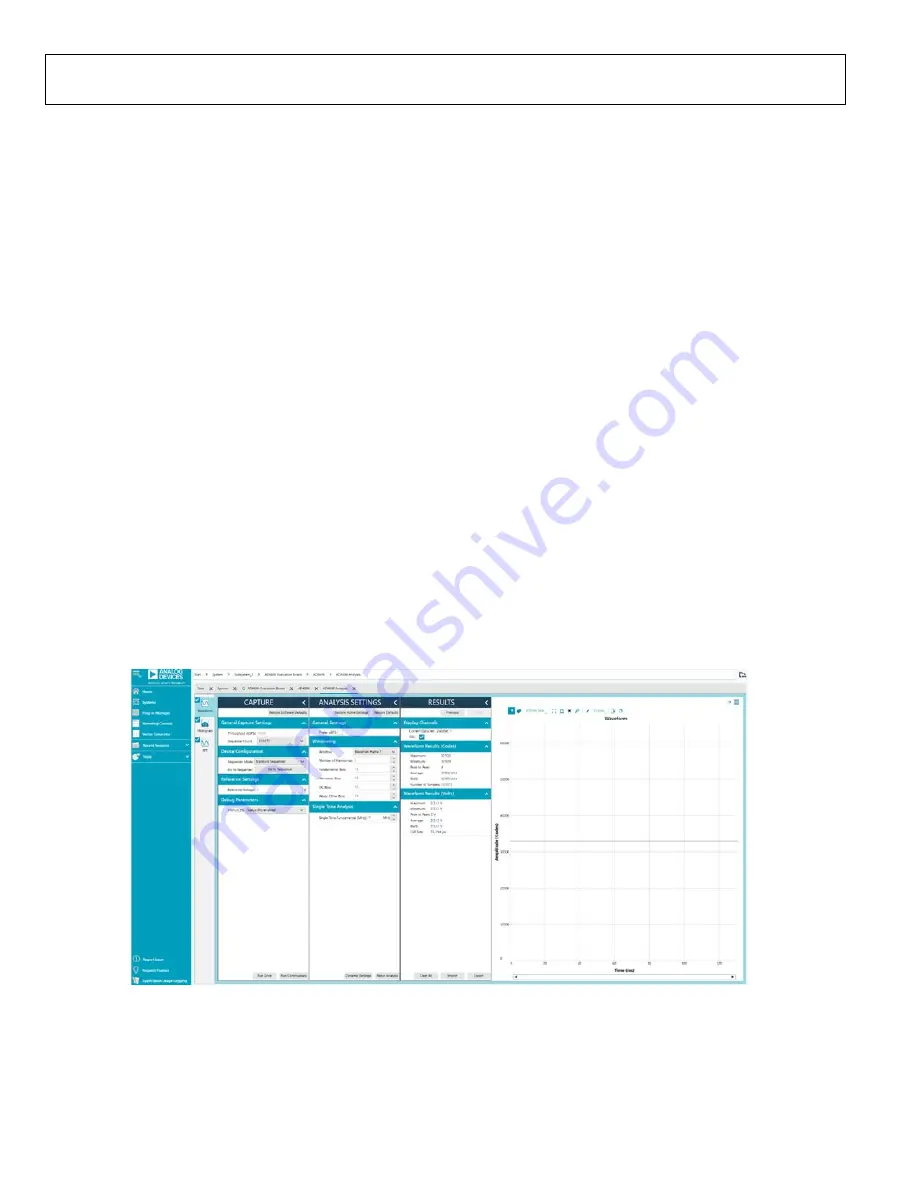
ANALYSIS VIEW
The analysis view includes controls to configure and perform
ADC data capture as well as to display the captured data and
analysis summary of the performance of connected hardware.
Click the
Proceed to Analysis
button in the chip view to open
the analysis view, as shown in Figure 15.
The analysis view contains the
Waveform
tab,
Histogram
tab, and
FFT
tab, each described in the Waveform Tab section, Histogram
Tab section, and FFT Tab section, respectively. These tabs display
data and analyzed performance of the data captured from the
connected hardware.
The
Waveform
,
Histogram
, and
FFT
tabs each display the
CAPTURE
pane and the
ANALYSIS SETTINGS
pane. The
CAPTURE
pane includes controls for configuring the ADC data
capture (see the Capture Pane section). The
ANALYSIS
SETTINGS
pane includes settings and parameters for frequency
domain analysis, including FFT calculation and ac performance
calculations (see the Analysis Settings section).
25
058
-0
2
1
Figure 20. Analysis View with
Waveform
Tab Selected


