


Getting started
R&S
®
ZND
71
User Manual 1173.9557.02 ─ 61
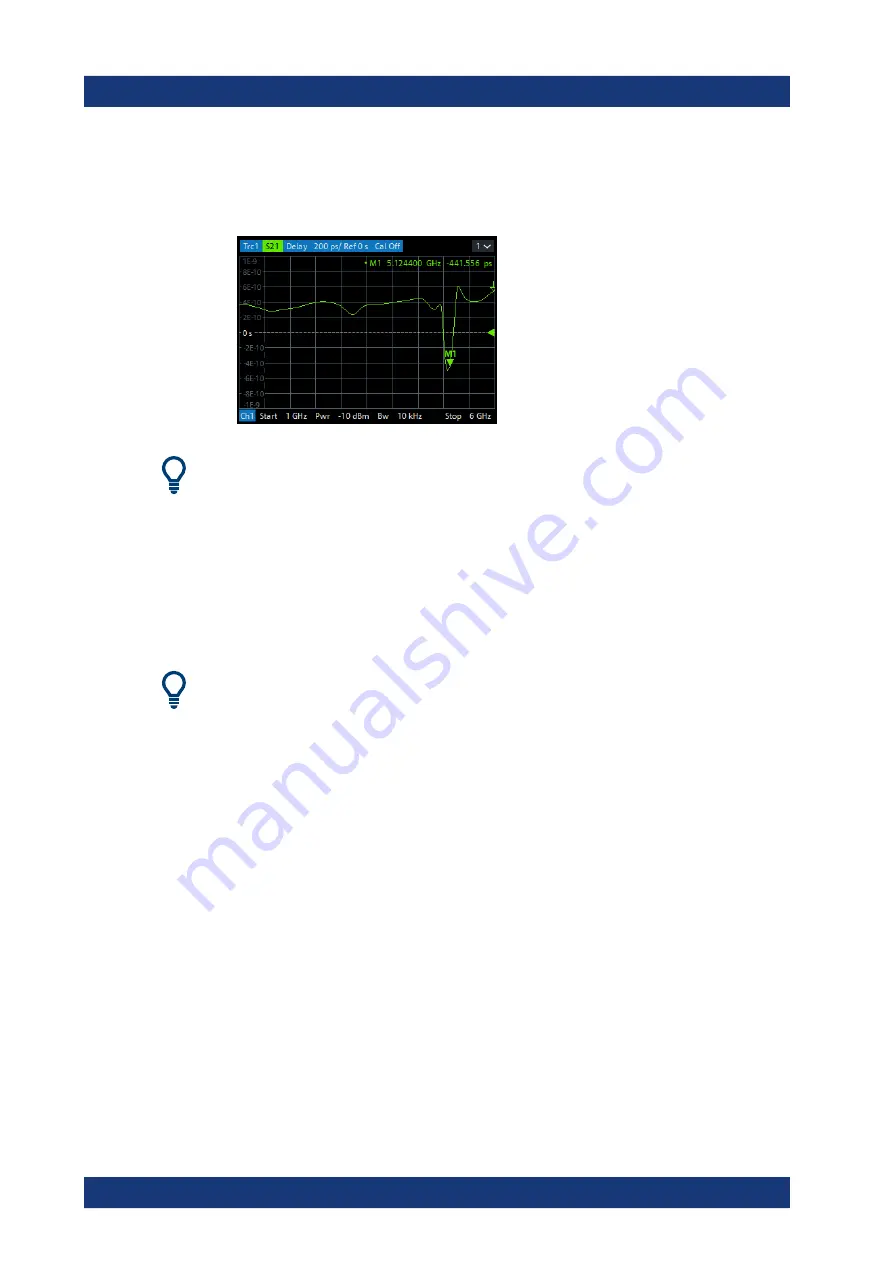
The group delay represents the propagation time of the wave through the DUT; it is
displayed in a Cartesian diagram. The marker info field shows the frequency and
group delay at the marker position.
Chapter 4.2.3, "Trace formats"
on page 100 to learn more about the diagram
properties.
3.4.1.5
Saving and printing data
The analyzer provides standard functions for saving measurement settings and for
saving or printing the results. You can use these functions as if you were working on a
standard PC. Moreover you can export your trace data to an ASCII file and reuse it in a
later session or in an external application.
Data transfer is made easier if external accessories are connected to the analyzer or if
the instrument is integrated into a LAN. Refer to
Chapter 3.1.11, "Connecting external
Chapter 12.1.2, "Remote operation in a LAN"
on page 1186 to obtain information about the necessary steps.
1. Activate the SYSTEM – [FILE] > "Trace Data" softtool tab.
2. In the "Trace Data" softtool tab, select "Export" – "ASCII..." to open the "Export
Data - ASCII Files" dialog.
3. In the "Export Data - ASCII Files" dialog:
a) Select a file location ("Look in:").
b) Enter a file name ("File name:").
c) Select "Save".
The analyzer writes the data of the active trace to an ASCII file and closes the dia-
log.
4. Activate the "Print" softtool tab (SYSTEM – [FILE] > "Print") .
5. In the "Print" softtool tab, select "Print" to print the diagram area or "To Clipboard"
to copy it to the Windows clipboard.
6. Select SYSTEM – [FILE] > "Recall Sets" > "Save..." to open the "Save" dialog for
recall sets.
Performing measurements
www.allice.de
Allice Messtechnik GmbH