


6 - Getting Started
Graph view Menu
36
SMU4000 Series Instruction Manual
Graph view Menu
HOME >
Graph View
Graph View uses Auto-fit scaling- displaying the results in an automatically scaled view to best fit
the display; all the results will be shown at once. Graph view utilizes no standard range scaling,
the scaling is entirely arbitrary, allowing the results to fill the graphical area. The auto-fit scaling
also deals with any offsets within the measurement data, offsetting the graphical view
accordingly. This provides an instant graphical view of all the buffered measurement data, scaled
to fit perfectly within the graphical window area. The Graph View menu has a darker (black)
background than the Graph menu, to assist with recognition.
NOTE
Scaling or panning functions are not available in Graph View.
Although scaling or panning options are not available, one method that can be implemented for
focusing in on an area of interest can be to re-run a specific test within the window of interest.
Graph view allows for the quick and easy view of the full measurement buffer data, which
means that a specific area of interest is very easy to find, especially with the use of the markers.
As an example, re-running an I/V trace curve sweep of a DUT around the area of interest can be
potentially quicker and provide greater measurement resolution than trying to pan and zoom
into a specific area of a graph under manual control.
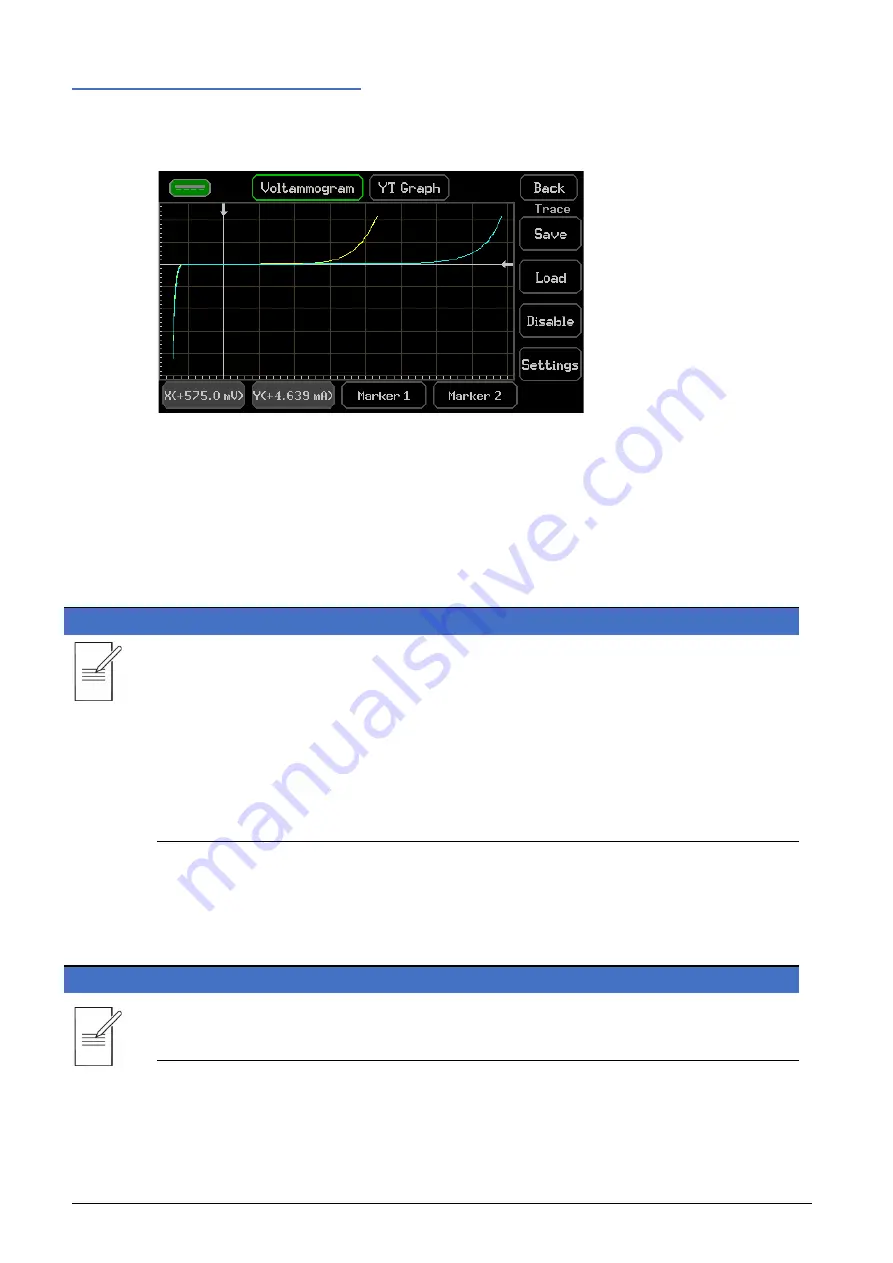
The Graph View menu allows the use of Markers and the reference Trace function to view,
assess, and compare the results. The graph type can be set to YT Graph or Voltammogram, and
graph style to Point or Line see
’ for more details on these functions.
NOTE
When a USB Flash Drive is present, screen captures of the graph can be stored by pressing the
flash Drive symbol in the top left corner.