Using the Multiport Test System
How to Use Frequency Zoom
Chapter 3
55
The
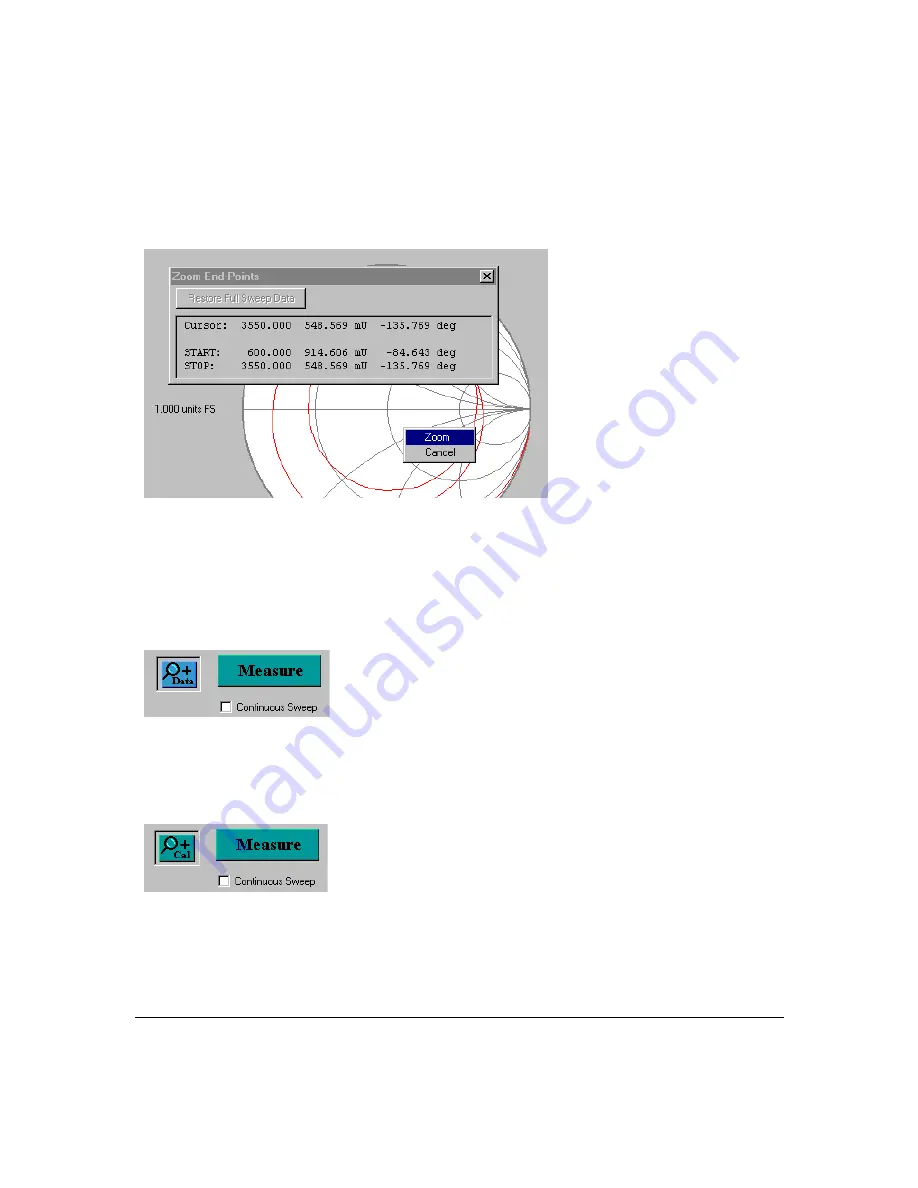
STOP
: line shows the ending frequency and a two-line confirmation menu displays:
7. Click on
Zoom
to confirm selected settings. The part of the trace between the start and
stop points is zoomed.
8. To restore the original measurement range, right click in the gray area outside of the plot
to display the display properties menu and select
Restore Full Sweep Data
from the
menu.
If frequency zooming has been applied to the data, the
+Data
button appears in the indicator
bar:
If a measurement is made after the frequency axis is zoomed, only the points within the zoom
range are measured. This creates a new set of calibration data adjusted to the new frequency
range.
As soon as the measurement starts, the
+Cal
button appears in the indicator bar to show that
the calibration in use is a subset of the full calibration available:
At the end of the measurement, the
+Data
button disappears because all available
measurement points have been displaced.
Summary of Contents for N4413A
Page 4: ...iv ...
Page 11: ...1 1 About the Multiport Test System ...
Page 18: ...About the Multiport Test System Available Options and Accessories Chapter 1 8 ...
Page 19: ...9 2 User Interface ...
Page 27: ...17 3 Using the Multiport Test System ...
Page 89: ...79 4 Performing Time Domain Measurements ...
Page 109: ...99 5 Menu Reference ...
Page 163: ...153 6 Maintenance and Troubleshooting ...
Page 172: ...Maintenance and Troubleshooting Contacting Agilent Chapter 6 162 ...
Page 173: ...163 7 Instrument Information ...
Page 208: ...Instrument Information Specifications and Characteristics Chapter 7 198 ...
Page 209: ...199 8 Safety and Regulatory Information ...
Page 218: ...Safety and Regulatory Information Regulatory Information Chapter 8 208 ...
Page 219: ...209 A Other Technical Procedures ...
Page 224: ...Other Technical Procedures IF Gain Adjustment Appendix A 214 ...


