


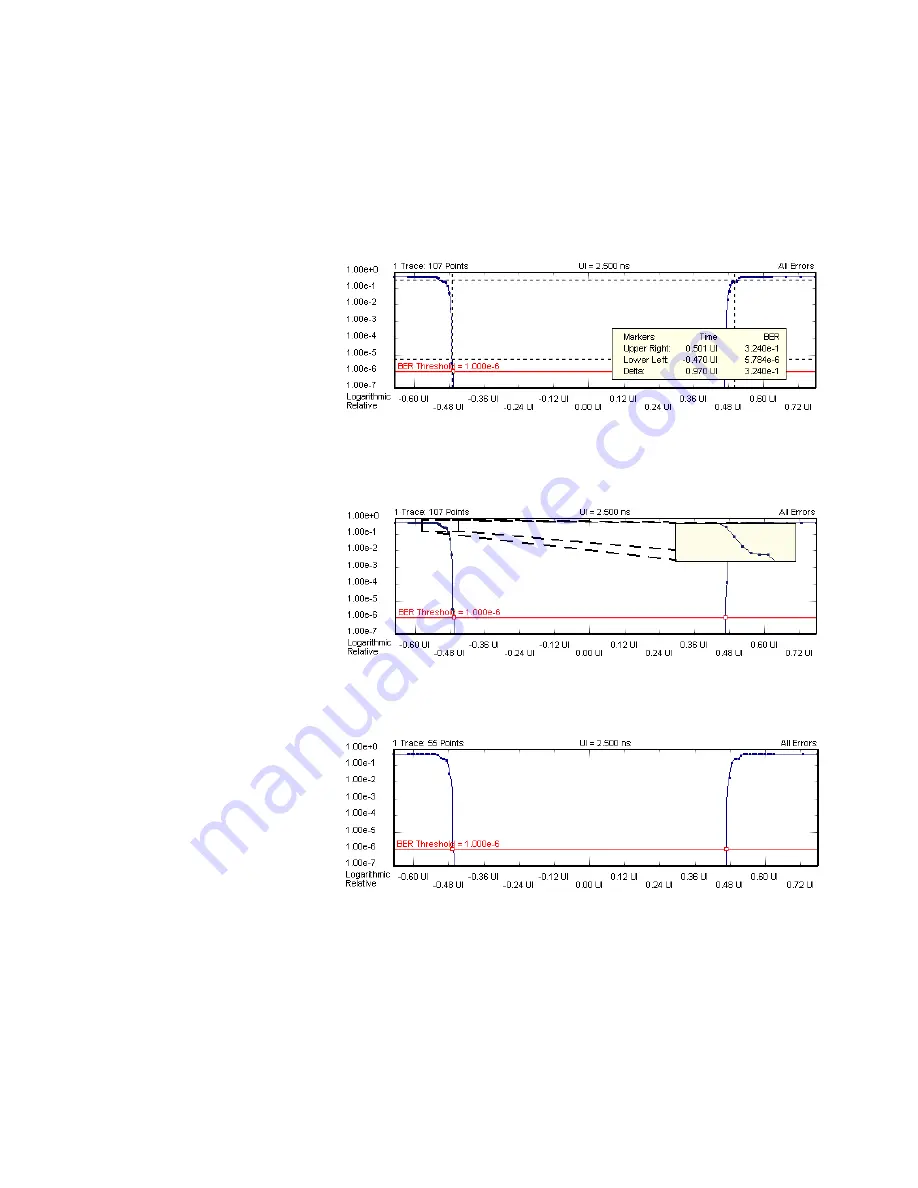
To analyze the graphs at a particular point, you can use the markers. Additionally,
you can display all related values for the markers in the marker readout.
Pressing the
Reset Markers
button will set the markers back to the default
positions.
Several zoom factors are available. When you show the zoom graph, you can also
allow the zoom graph to track the mouse (or your finger, if you are working directly
on the Serial BERT).
If you want to see the points that have actually been measured, choose
Show
Measured Points
.
Explanation of the Numerical Results
The measurement provides numerical results for:
The output timing measurement parameters are defined in the following table:
Advanced Analysis
6
Agilent J-BERT N4903B High-Performance Serial BERT
259
Markers
Zoom
Show Measured Points
Output Timing Measurement
Parameters
Summary of Contents for J-BERT N4903B
Page 1: ...S Agilent J BERT N4903B High Performance Serial BERT User Guide s Agilent Technologies ...
Page 10: ...10 Agilent J BERT N4903B High Performance Serial BERT ...
Page 36: ...1 Planning the Test 36 Agilent J BERT N4903B High Performance Serial BERT ...
Page 60: ...2 Setting up External Instrument s 60 Agilent J BERT N4903B High Performance Serial BERT ...
Page 120: ...3 Setting up Patterns 120 Agilent J BERT N4903B High Performance Serial BERT ...
Page 360: ...6 Advanced Analysis 360 Agilent J BERT N4903B High Performance Serial BERT ...
Page 468: ...8 Jitter Tolerance Tests 468 Agilent J BERT N4903B High Performance Serial BERT ...
Page 524: ...9 Solving Problems 524 Agilent J BERT N4903B High Performance Serial BERT ...
Page 566: ...10 Customizing the Instrument 566 Agilent J BERT N4903B High Performance Serial BERT ...