


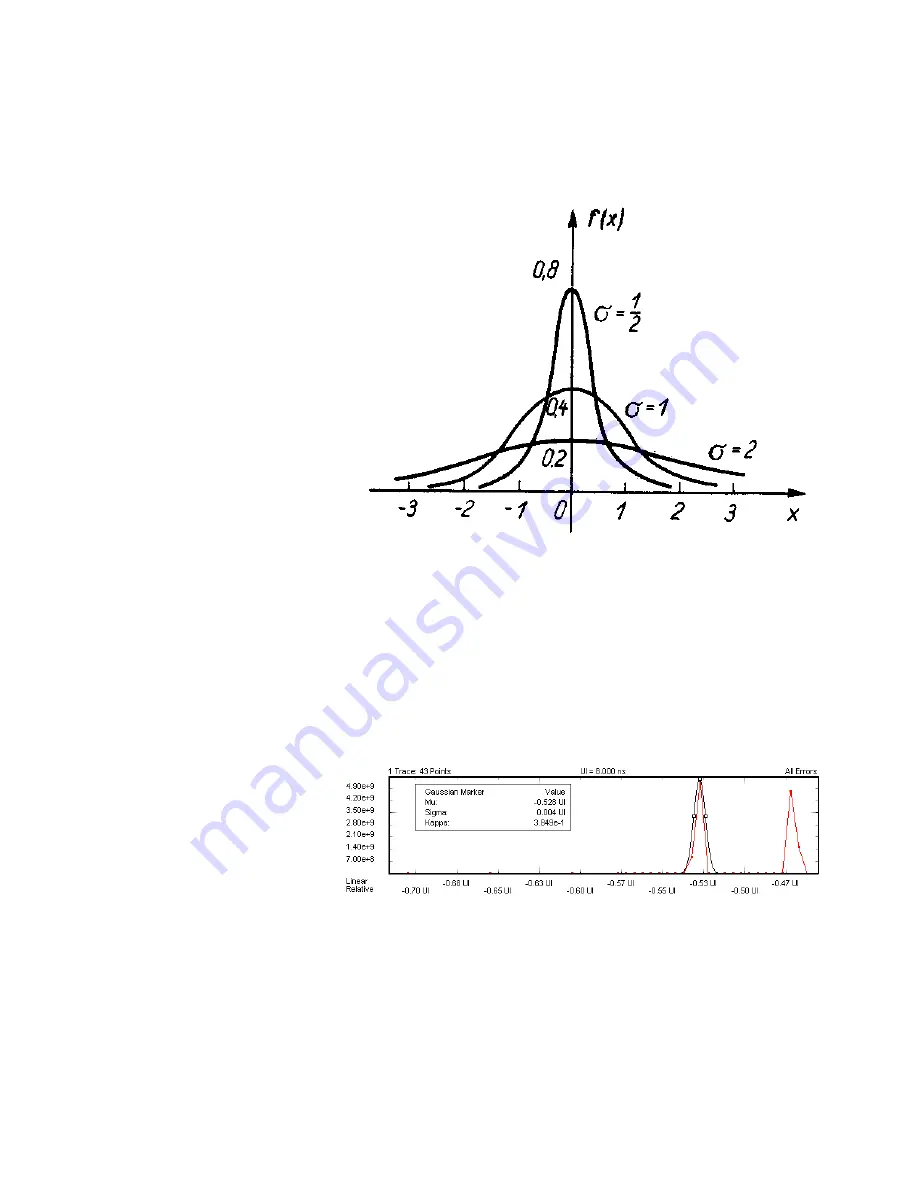
This formula describes a bell-shaped Gauss curve. If μ is zero and σ varied, you
would get the curves illustrated in the figure below:
The height and position of a normal distribution can be specified in terms of two
parameters: μ and σ. The parameter μ is the mean, the parameter σ is the standard
deviation.
The Gaussian marker shows such a curve. Position, height, and width of this curve
can be changed by dragging the handles, and the actual parameter values are
displayed.
The marker has three handles that can be dragged: two for adjusting its width, one
for changing its height and position.
The following figure shows an exemplary DUT Output Timing/Jitter measurement
result with a Gaussian marker.
The marker readout provides the following information:
6
Advanced Analysis
238
Agilent J-BERT N4903B High-Performance Serial BERT
Summary of Contents for J-BERT N4903B
Page 1: ...S Agilent J BERT N4903B High Performance Serial BERT User Guide s Agilent Technologies ...
Page 10: ...10 Agilent J BERT N4903B High Performance Serial BERT ...
Page 36: ...1 Planning the Test 36 Agilent J BERT N4903B High Performance Serial BERT ...
Page 60: ...2 Setting up External Instrument s 60 Agilent J BERT N4903B High Performance Serial BERT ...
Page 120: ...3 Setting up Patterns 120 Agilent J BERT N4903B High Performance Serial BERT ...
Page 360: ...6 Advanced Analysis 360 Agilent J BERT N4903B High Performance Serial BERT ...
Page 468: ...8 Jitter Tolerance Tests 468 Agilent J BERT N4903B High Performance Serial BERT ...
Page 524: ...9 Solving Problems 524 Agilent J BERT N4903B High Performance Serial BERT ...
Page 566: ...10 Customizing the Instrument 566 Agilent J BERT N4903B High Performance Serial BERT ...