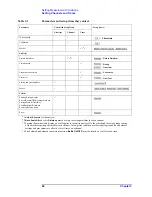


Table 3-3
Eight types of rectangular display formats
Type
Y-axis Data Type
Y-axis Unit
Application Examples
Log magnitude format
Magnitude
dB
•Return loss measurement
•Insertion loss measurement (or
gain measurement)
Phase format
Phase (displayed in range from
−
180
°
to
+180
°
)
Degrees (
°
)
•Measurement of deviation
from linear phase
Expanded phase format
Phase (can be displayed above +180
°
and
below
−
180
°
)
Degrees (
°
)
•Measurement of deviation
from linear phase
Positive phase format
Phase (displayed in range from 0
°
to
+360
°
)
Degrees (
°
)
•Measurement of deviation
from linear phase
Group delay format
Signal transfer delays within the DUT
Seconds (s)
•Group delay measurement
Linear magnitude format
Magnitude
(Abstract
number)
•Reflection coefficient
measurement
SWR format
1
ρ
+
1
ρ
–
------------ (
ρ
: reflection coefficient)
(Abstract
number)
•Measurement of standing wave
ratio
Real format
Real part of measured complex parameter
(Abstract
number)
Imaginary format
Imaginary part of measured complex
parameter
(Abstract
number)
82
Chapter 3
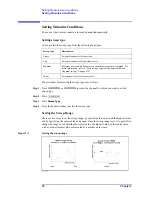
Setting Measurement Conditions
Selecting a Data Format
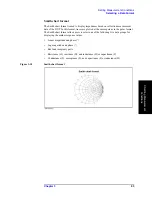
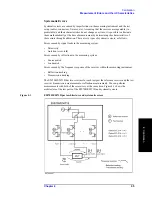
Polar format
In the polar format, traces are drawn by expressing the magnitude as a displacement from
the origin (linear) and phase in an angle counterclockwise from the positive X-axis. This
data format does not have a stimulus axis, so frequencies must be read by using the marker.
The polar format allows users to select one of the following three data groups for
displaying the marker response values.
•
Linear magnitude and phase (
°
)
•
Log magnitude and phase (
°
)
•
Real and imaginary parts
Figure 3-9
Polar format
Summary of Contents for E5070B
Page 6: ......
Page 30: ...24 Contents ...
Page 34: ...28 Chapter1 Precautions Before contacting us ...
Page 286: ...280 Chapter6 Data Analysis Using the Equation Editor ...
Page 430: ...424 Chapter12 Optimizing Measurements Performing a Segment by Segment Sweep segment sweep ...
Page 538: ...532 Chapter15 Measurement Examples Executing Power Calibration ...
Page 634: ...628 AppendixB Troubleshooting Warning Message ...
Page 732: ...726 AppendixD Softkey Functions Trigger Menu ...
Page 740: ...734 AppendixE General Principles of Operation Data Processing ...
Page 760: ...754 AppendixF Replacing the 8753ES with the E5070B E5071B Comparing Functions ...


