


4-4
Chapter 4
Reading Analyzer Data
Marker Data
Marker Data
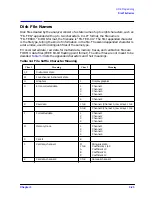
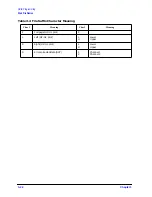
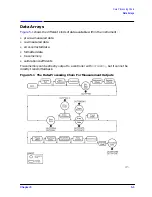
The analyzer offers several options for outputting trace-related data. Data can be
selectively read from the trace using the markers, or the entire trace can be read by the
controller. If only specific information is required (such as a single point on the trace or the
result of a marker search), the marker output command can be used to read the
information. Specific data points can be read using the
OUTPDATP
or
OUTPDATR
commands.
These commands allow a much faster data transfer than when using markers to output
specific data points. For more information on these commands, see
Point Special Functions” on page 7-126
.
A marker must first be assigned to the desired frequency before it can be used to read the
trace data. This is accomplished using the marker commands. The controller sends a
marker command followed by a frequency within the trace-data range. If the actual
desired frequency was not sampled, the markers can be set to continuous mode and the
desired marker value will be linearly interpolated from the two nearest points. This
interpolation can be prevented by putting the markers into discrete mode. Discrete mode
allows the marker to only be positioned on a measured trace-data point.
As an alternative, the analyzer can be programmed to choose the stimulus value by using
the
functions. Maximum, minimum, target value, or bandwidth search can
be automatically determined with
functions. To continually update the
search, switch the marker tracking on. The trace-value search will remain activated until
one of the following occurs:
• The search is switched off.
• The tracking is switched off.
• All markers are switched off.
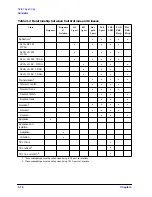
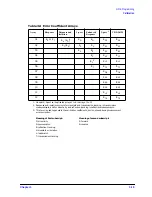
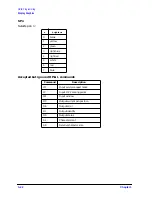
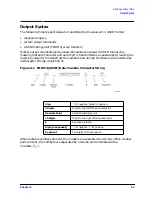
Marker data can be output to a controller by using analyzer commands. These commands
cause the analyzer to transmit three numbers: marker value 1, marker value 2, and
marker stimulus value. For example, in log-magnitude display mode we get the log
magnitude at the marker (value 1), zero (value 2), and the marker frequency. See
for a complete listing of all the possibilities for values 1 and 2. The four possibilities for the
marker stimulus value are:
• frequency
• time (as in time domain, Option 010 only)
• CW time
• power (in power sweep mode)
Marker Search
Marker Search
Summary of Contents for 8719ES
Page 15: ...1 1 1 Alphabetical Command Reference ...
Page 293: ...2 1 2 Introduction to Instrument Control ...
Page 310: ...3 1 3 GPIB Programming ...
Page 334: ...4 1 4 Reading Analyzer Data ...
Page 343: ...5 1 5 Data Processing Chain ...
Page 350: ...6 1 6 Error Reporting ...
Page 364: ...7 1 7 Programming Examples ...
Page 502: ...A 1 A Preset Conditions ...
Page 517: ...B 1 B Command Listings ...


